Guatemalan vs Somali 4 or more Vehicles in Household
COMPARE
Guatemalan
Somali
4 or more Vehicles in Household
4 or more Vehicles in Household Comparison
Guatemalans
Somalis
7.0%
4 OR MORE VEHICLES IN HOUSEHOLD
98.1/ 100
METRIC RATING
106th/ 347
METRIC RANK
5.0%
4 OR MORE VEHICLES IN HOUSEHOLD
0.0/ 100
METRIC RATING
305th/ 347
METRIC RANK
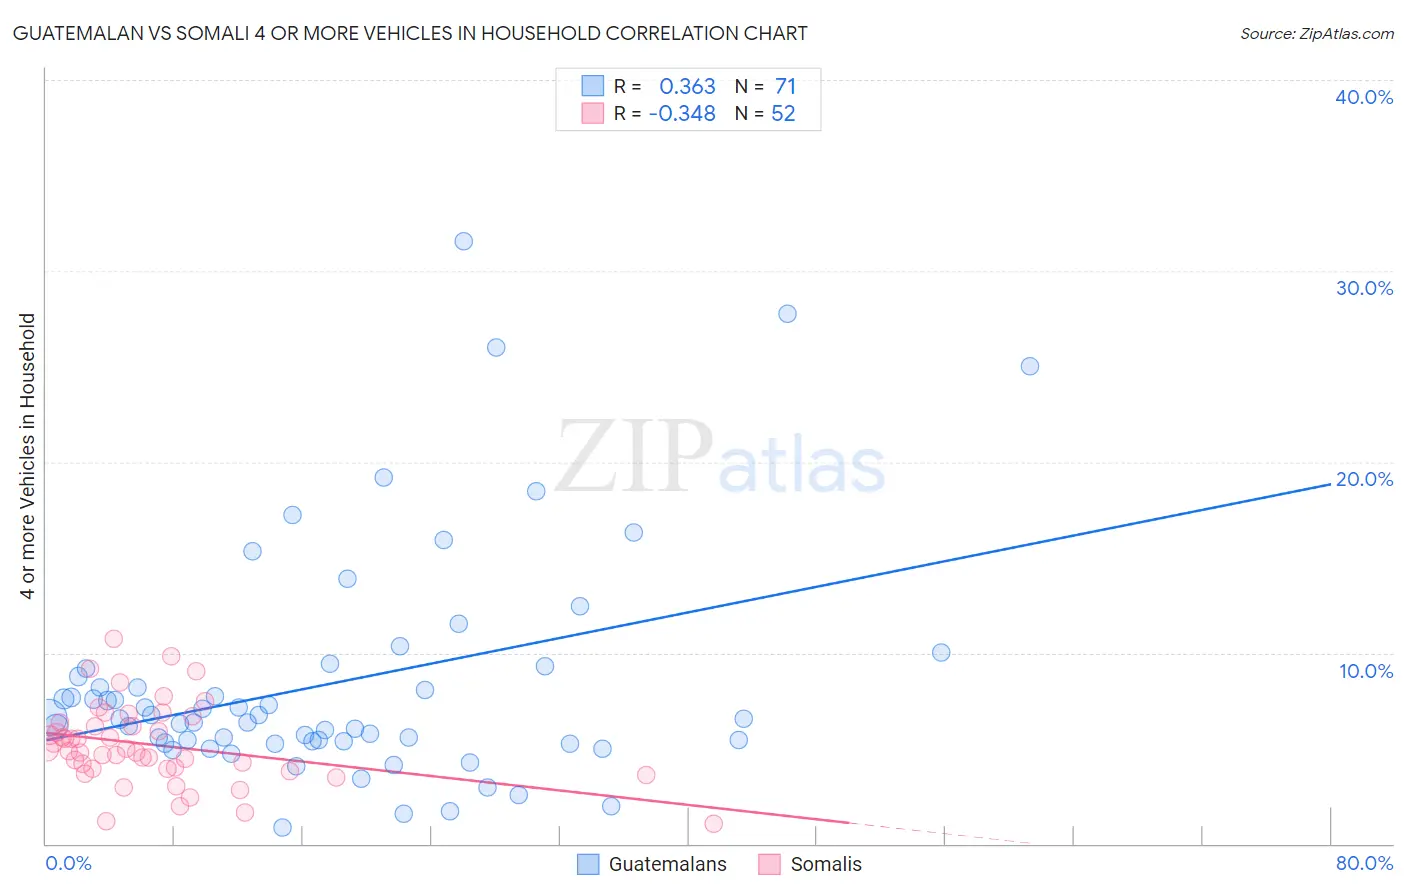
Guatemalan vs Somali 4 or more Vehicles in Household Correlation Chart
The statistical analysis conducted on geographies consisting of 407,811,821 people shows a mild positive correlation between the proportion of Guatemalans and percentage of households with 4 or more vehicles available in the United States with a correlation coefficient (R) of 0.363 and weighted average of 7.0%. Similarly, the statistical analysis conducted on geographies consisting of 99,181,169 people shows a mild negative correlation between the proportion of Somalis and percentage of households with 4 or more vehicles available in the United States with a correlation coefficient (R) of -0.348 and weighted average of 5.0%, a difference of 38.4%.
4 or more Vehicles in Household Correlation Summary
| Measurement | Guatemalan | Somali |
| Minimum | 0.82% | 1.0% |
| Maximum | 31.6% | 10.8% |
| Range | 30.8% | 9.7% |
| Mean | 8.5% | 5.2% |
| Median | 6.6% | 4.9% |
| Interquartile 25% (IQ1) | 5.4% | 3.9% |
| Interquartile 75% (IQ3) | 9.2% | 6.2% |
| Interquartile Range (IQR) | 3.8% | 2.3% |
| Standard Deviation (Sample) | 6.1% | 2.1% |
| Standard Deviation (Population) | 6.0% | 2.1% |
Similar Demographics by 4 or more Vehicles in Household
Demographics Similar to Guatemalans by 4 or more Vehicles in Household
In terms of 4 or more vehicles in household, the demographic groups most similar to Guatemalans are Nicaraguan (7.0%, a difference of 0.010%), German Russian (7.0%, a difference of 0.34%), Hmong (7.0%, a difference of 0.35%), French (6.9%, a difference of 0.35%), and Filipino (6.9%, a difference of 0.53%).
| Demographics | Rating | Rank | 4 or more Vehicles in Household |
| Seminole | 98.8 /100 | #99 | Exceptional 7.0% |
| Taiwanese | 98.7 /100 | #100 | Exceptional 7.0% |
| Pakistanis | 98.7 /100 | #101 | Exceptional 7.0% |
| Asians | 98.6 /100 | #102 | Exceptional 7.0% |
| Blackfeet | 98.6 /100 | #103 | Exceptional 7.0% |
| Hmong | 98.3 /100 | #104 | Exceptional 7.0% |
| German Russians | 98.3 /100 | #105 | Exceptional 7.0% |
| Guatemalans | 98.1 /100 | #106 | Exceptional 7.0% |
| Nicaraguans | 98.0 /100 | #107 | Exceptional 7.0% |
| French | 97.7 /100 | #108 | Exceptional 6.9% |
| Filipinos | 97.6 /100 | #109 | Exceptional 6.9% |
| Immigrants | Thailand | 97.0 /100 | #110 | Exceptional 6.9% |
| Aleuts | 97.0 /100 | #111 | Exceptional 6.9% |
| Hopi | 97.0 /100 | #112 | Exceptional 6.9% |
| Canadians | 96.4 /100 | #113 | Exceptional 6.9% |
Demographics Similar to Somalis by 4 or more Vehicles in Household
In terms of 4 or more vehicles in household, the demographic groups most similar to Somalis are Cypriot (5.0%, a difference of 0.0%), Immigrants from Serbia (5.0%, a difference of 0.090%), Immigrants from Greece (5.1%, a difference of 0.56%), Bahamian (5.1%, a difference of 1.0%), and Menominee (5.0%, a difference of 1.0%).
| Demographics | Rating | Rank | 4 or more Vehicles in Household |
| Immigrants | South America | 0.1 /100 | #298 | Tragic 5.2% |
| Immigrants | Ghana | 0.1 /100 | #299 | Tragic 5.2% |
| Immigrants | Morocco | 0.0 /100 | #300 | Tragic 5.1% |
| Immigrants | Zaire | 0.0 /100 | #301 | Tragic 5.1% |
| Bahamians | 0.0 /100 | #302 | Tragic 5.1% |
| Immigrants | Greece | 0.0 /100 | #303 | Tragic 5.1% |
| Cypriots | 0.0 /100 | #304 | Tragic 5.0% |
| Somalis | 0.0 /100 | #305 | Tragic 5.0% |
| Immigrants | Serbia | 0.0 /100 | #306 | Tragic 5.0% |
| Menominee | 0.0 /100 | #307 | Tragic 5.0% |
| Paraguayans | 0.0 /100 | #308 | Tragic 4.9% |
| Immigrants | Somalia | 0.0 /100 | #309 | Tragic 4.9% |
| Moroccans | 0.0 /100 | #310 | Tragic 4.9% |
| Houma | 0.0 /100 | #311 | Tragic 4.9% |
| Albanians | 0.0 /100 | #312 | Tragic 4.8% |