French Married-couple Households
COMPARE
French
Select to Compare
Married-couple Households
French Married-couple Households
48.0%
MARRIED-COUPLE HOUSEHOLDS
97.2/ 100
METRIC RATING
90th/ 347
METRIC RANK
French Married-couple Households Correlation Chart
The statistical analysis conducted on geographies consisting of 571,775,805 people shows a substantial positive correlation between the proportion of French and percentage of married-couple family households in the United States with a correlation coefficient (R) of 0.541 and weighted average of 48.0%. On average, for every 1% (one percent) increase in French within a typical geography, there is an increase of 0.44% in percentage of married-couple family households.
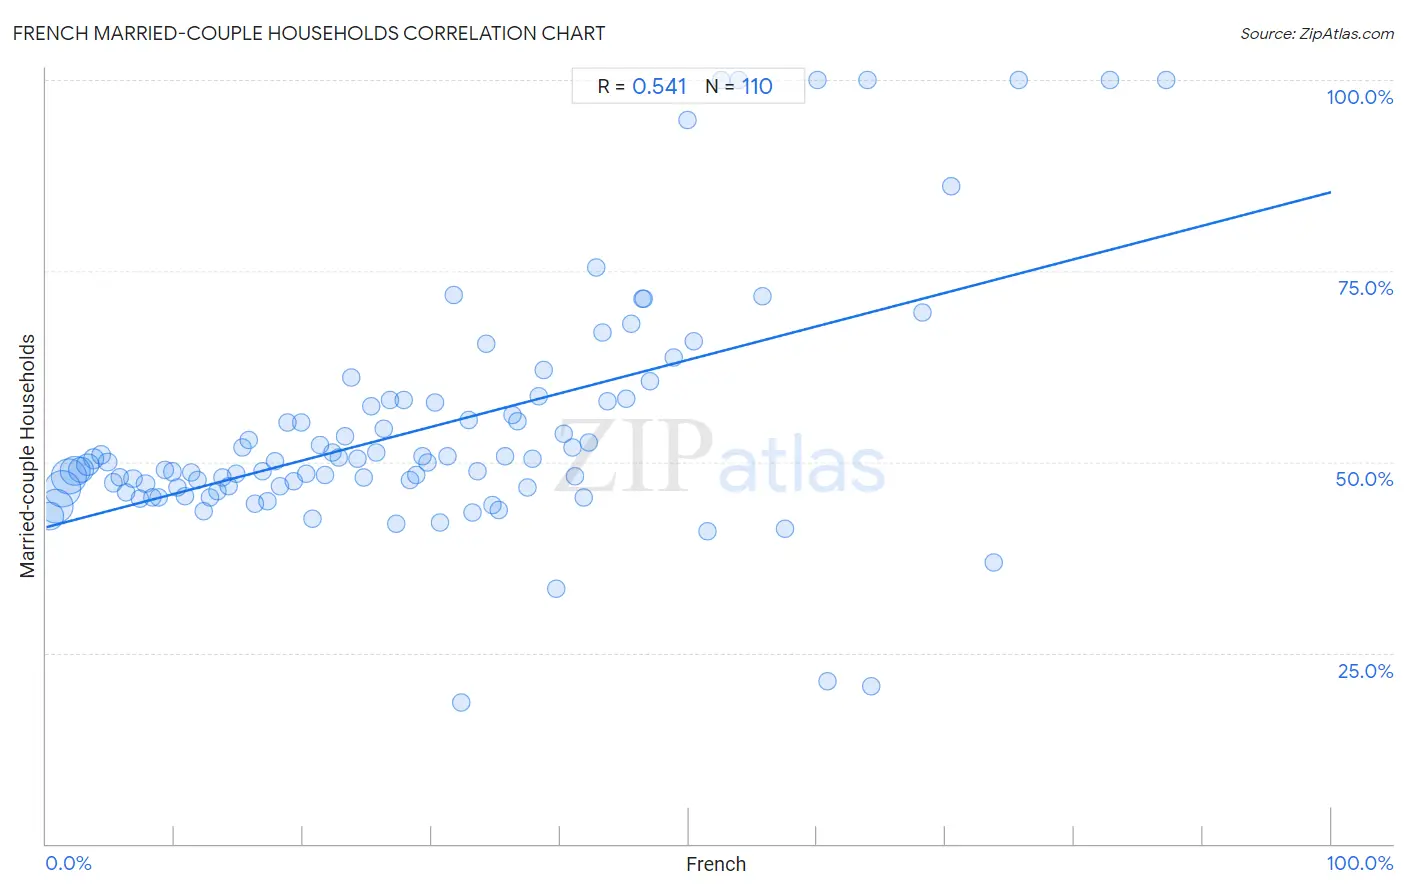
It is essential to understand that the correlation between the percentage of French and percentage of married-couple family households does not imply a direct cause-and-effect relationship. It remains uncertain whether the presence of French influences an upward or downward trend in the level of percentage of married-couple family households within an area, or if French simply ended up residing in those areas with higher or lower levels of percentage of married-couple family households due to other factors.
Demographics Similar to French by Married-couple Households
In terms of married-couple households, the demographic groups most similar to French are Cypriot (48.0%, a difference of 0.010%), Afghan (48.0%, a difference of 0.040%), Immigrants from Ireland (48.0%, a difference of 0.050%), Belgian (48.0%, a difference of 0.060%), and Immigrants from Moldova (48.0%, a difference of 0.060%).
| Demographics | Rating | Rank | Married-couple Households |
| Guamanians/Chamorros | 97.6 /100 | #83 | Exceptional 48.1% |
| Ukrainians | 97.6 /100 | #84 | Exceptional 48.1% |
| Immigrants from Israel | 97.4 /100 | #85 | Exceptional 48.0% |
| Belgians | 97.4 /100 | #86 | Exceptional 48.0% |
| Immigrants from Ireland | 97.3 /100 | #87 | Exceptional 48.0% |
| Afghans | 97.3 /100 | #88 | Exceptional 48.0% |
| Cypriots | 97.2 /100 | #89 | Exceptional 48.0% |
| French | 97.2 /100 | #90 | Exceptional 48.0% |
| Immigrants from Moldova | 97.0 /100 | #91 | Exceptional 48.0% |
| Palestinians | 96.9 /100 | #92 | Exceptional 48.0% |
| Lebanese | 96.9 /100 | #93 | Exceptional 47.9% |
| Americans | 96.9 /100 | #94 | Exceptional 47.9% |
| Immigrants from Belgium | 96.8 /100 | #95 | Exceptional 47.9% |
| Immigrants from Egypt | 96.6 /100 | #96 | Exceptional 47.9% |
| Latvians | 96.5 /100 | #97 | Exceptional 47.9% |
French Married-couple Households Correlation Summary
| Measurement | French Data | Married-couple Households Data |
| Minimum | 0.26% | 18.5% |
| Maximum | 87.2% | 100.0% |
| Range | 86.9% | 81.5% |
| Mean | 29.6% | 54.4% |
| Median | 27.5% | 49.9% |
| Interquartile 25% (IQ1) | 13.7% | 46.7% |
| Interquartile 75% (IQ3) | 41.8% | 57.9% |
| Interquartile Range (IQR) | 28.1% | 11.2% |
| Standard Deviation (Sample) | 19.7% | 16.0% |
| Standard Deviation (Population) | 19.6% | 15.9% |
Correlation Details
| French Percentile | Sample Size | Married-couple Households |
[ 0.0% - 0.5% ] 0.26% | 61,469,300 | 42.9% |
[ 0.5% - 1.0% ] 0.77% | 96,986,323 | 44.1% |
[ 1.0% - 1.5% ] 1.25% | 110,948,020 | 46.4% |
[ 1.5% - 2.0% ] 1.74% | 101,374,780 | 48.1% |
[ 2.0% - 2.5% ] 2.24% | 71,488,926 | 48.8% |
[ 2.5% - 3.0% ] 2.72% | 46,757,164 | 48.9% |
[ 3.0% - 3.5% ] 3.22% | 26,077,091 | 49.6% |
[ 3.5% - 4.0% ] 3.72% | 14,646,669 | 50.5% |
[ 4.0% - 4.5% ] 4.24% | 8,792,317 | 50.9% |
[ 4.5% - 5.0% ] 4.75% | 5,729,495 | 50.0% |
[ 5.0% - 5.5% ] 5.23% | 4,681,732 | 47.2% |
[ 5.5% - 6.0% ] 5.74% | 2,809,551 | 48.0% |
[ 6.0% - 6.5% ] 6.23% | 1,743,329 | 46.0% |
[ 6.5% - 7.0% ] 6.75% | 1,723,833 | 47.8% |
[ 7.0% - 7.5% ] 7.26% | 1,311,442 | 45.2% |
[ 7.5% - 8.0% ] 7.72% | 1,272,138 | 47.2% |
[ 8.0% - 8.5% ] 8.23% | 1,260,423 | 45.3% |
[ 8.5% - 9.0% ] 8.76% | 1,045,933 | 45.4% |
[ 9.0% - 9.5% ] 9.21% | 1,120,951 | 49.0% |
[ 9.5% - 10.0% ] 9.78% | 1,031,203 | 48.7% |
[ 10.0% - 10.5% ] 10.23% | 723,052 | 46.7% |
[ 10.5% - 11.0% ] 10.80% | 1,127,366 | 45.5% |
[ 11.0% - 11.5% ] 11.24% | 446,248 | 48.6% |
[ 11.5% - 12.0% ] 11.75% | 425,951 | 47.6% |
[ 12.0% - 12.5% ] 12.26% | 619,914 | 43.5% |
[ 12.5% - 13.0% ] 12.76% | 597,975 | 45.3% |
[ 13.0% - 13.5% ] 13.29% | 687,578 | 46.2% |
[ 13.5% - 14.0% ] 13.71% | 499,775 | 48.0% |
[ 14.0% - 14.5% ] 14.24% | 575,830 | 46.8% |
[ 14.5% - 15.0% ] 14.76% | 347,622 | 48.5% |
[ 15.0% - 15.5% ] 15.27% | 457,977 | 51.8% |
[ 15.5% - 16.0% ] 15.79% | 323,159 | 52.8% |
[ 16.0% - 16.5% ] 16.24% | 478,023 | 44.6% |
[ 16.5% - 17.0% ] 16.80% | 340,009 | 48.8% |
[ 17.0% - 17.5% ] 17.24% | 171,729 | 44.9% |
[ 17.5% - 18.0% ] 17.78% | 292,355 | 50.1% |
[ 18.0% - 18.5% ] 18.20% | 180,802 | 46.8% |
[ 18.5% - 19.0% ] 18.76% | 62,694 | 55.2% |
[ 19.0% - 19.5% ] 19.25% | 83,339 | 47.4% |
[ 19.5% - 20.0% ] 19.81% | 154,749 | 55.2% |
[ 20.0% - 20.5% ] 20.24% | 57,380 | 48.5% |
[ 20.5% - 21.0% ] 20.73% | 138,956 | 42.5% |
[ 21.0% - 21.5% ] 21.27% | 83,329 | 52.1% |
[ 21.5% - 22.0% ] 21.69% | 72,425 | 48.4% |
[ 22.0% - 22.5% ] 22.28% | 62,402 | 51.2% |
[ 22.5% - 23.0% ] 22.77% | 63,770 | 50.5% |
[ 23.0% - 23.5% ] 23.26% | 90,366 | 53.4% |
[ 23.5% - 24.0% ] 23.78% | 48,680 | 61.0% |
[ 24.0% - 24.5% ] 24.22% | 35,013 | 50.3% |
[ 24.5% - 25.0% ] 24.74% | 19,899 | 48.0% |
[ 25.0% - 25.5% ] 25.29% | 16,831 | 57.2% |
[ 25.5% - 26.0% ] 25.73% | 7,494 | 51.2% |
[ 26.0% - 26.5% ] 26.25% | 21,053 | 54.4% |
[ 26.5% - 27.0% ] 26.77% | 7,997 | 58.1% |
[ 27.0% - 27.5% ] 27.25% | 28,335 | 41.8% |
[ 27.5% - 28.0% ] 27.79% | 21,310 | 58.1% |
[ 28.0% - 28.5% ] 28.28% | 16,541 | 47.6% |
[ 28.5% - 29.0% ] 28.78% | 9,005 | 48.2% |
[ 29.0% - 29.5% ] 29.28% | 20,020 | 50.8% |
[ 29.5% - 30.0% ] 29.72% | 8,574 | 49.9% |
[ 30.0% - 30.5% ] 30.24% | 3,809 | 57.7% |
[ 30.5% - 31.0% ] 30.61% | 6,027 | 42.0% |
[ 31.0% - 31.5% ] 31.23% | 8,027 | 50.7% |
[ 31.5% - 32.0% ] 31.76% | 148 | 71.8% |
[ 32.0% - 32.5% ] 32.25% | 524 | 18.5% |
[ 32.5% - 33.0% ] 32.86% | 3,947 | 55.5% |
[ 33.0% - 33.5% ] 33.19% | 4,170 | 43.4% |
[ 33.5% - 34.0% ] 33.60% | 997 | 48.8% |
[ 34.0% - 34.5% ] 34.29% | 1,782 | 65.4% |
[ 34.5% - 35.0% ] 34.69% | 8,359 | 44.3% |
[ 35.0% - 35.5% ] 35.24% | 1,938 | 43.8% |
[ 35.5% - 36.0% ] 35.73% | 1,198 | 50.7% |
[ 36.0% - 36.5% ] 36.31% | 2,702 | 56.2% |
[ 36.5% - 37.0% ] 36.70% | 4,741 | 55.3% |
[ 37.0% - 37.5% ] 37.50% | 3,547 | 46.7% |
[ 37.5% - 38.0% ] 37.87% | 375 | 50.5% |
[ 38.0% - 38.5% ] 38.30% | 5,841 | 58.5% |
[ 38.5% - 39.0% ] 38.69% | 3,107 | 62.0% |
[ 39.5% - 40.0% ] 39.67% | 1,346 | 33.4% |
[ 40.0% - 40.5% ] 40.32% | 888 | 53.7% |
[ 40.5% - 41.0% ] 40.91% | 330 | 51.8% |
[ 41.0% - 41.5% ] 41.16% | 1,771 | 48.1% |
[ 41.5% - 42.0% ] 41.79% | 1,352 | 45.3% |
[ 42.0% - 42.5% ] 42.23% | 959 | 52.6% |
[ 42.5% - 43.0% ] 42.75% | 1,663 | 75.5% |
[ 43.0% - 43.5% ] 43.32% | 1,332 | 66.9% |
[ 43.5% - 44.0% ] 43.66% | 284 | 57.9% |
[ 45.0% - 45.5% ] 45.15% | 1,165 | 58.2% |
[ 45.5% - 46.0% ] 45.54% | 303 | 68.1% |
[ 46.0% - 46.5% ] 46.39% | 97 | 71.4% |
[ 46.5% - 47.0% ] 46.51% | 43 | 71.4% |
[ 47.0% - 47.5% ] 47.01% | 134 | 60.6% |
[ 48.5% - 49.0% ] 48.84% | 86 | 63.6% |
[ 49.5% - 50.0% ] 49.90% | 511 | 94.7% |
[ 50.0% - 50.5% ] 50.38% | 1,046 | 65.8% |
[ 51.0% - 51.5% ] 51.42% | 1,474 | 40.9% |
[ 52.5% - 53.0% ] 52.51% | 219 | 100.0% |
[ 53.5% - 54.0% ] 53.85% | 65 | 100.0% |
[ 55.5% - 56.0% ] 55.77% | 1,854 | 71.6% |
[ 57.0% - 57.5% ] 57.50% | 40 | 41.2% |
[ 60.0% - 60.5% ] 60.00% | 25 | 100.0% |
[ 60.5% - 61.0% ] 60.77% | 130 | 21.2% |
[ 63.5% - 64.0% ] 63.89% | 180 | 100.0% |
[ 64.0% - 64.5% ] 64.21% | 95 | 20.7% |
[ 68.0% - 68.5% ] 68.20% | 239 | 69.5% |
[ 70.0% - 70.5% ] 70.45% | 335 | 86.1% |
[ 73.5% - 74.0% ] 73.72% | 137 | 36.8% |
[ 75.5% - 76.0% ] 75.71% | 70 | 100.0% |
[ 82.5% - 83.0% ] 82.74% | 168 | 100.0% |
[ 87.0% - 87.5% ] 87.18% | 78 | 100.0% |