French Wage/Income Gap
COMPARE
French
Select to Compare
Wage/Income Gap
French Wage/Income Gap
28.7%
WAGE/INCOME GAP
0.1/ 100
METRIC RATING
313th/ 347
METRIC RANK
French Wage/Income Gap Correlation Chart
The statistical analysis conducted on geographies consisting of 569,574,307 people shows a mild positive correlation between the proportion of French and wage/income gap percentage in the United States with a correlation coefficient (R) of 0.382 and weighted average of 28.7%. On average, for every 1% (one percent) increase in French within a typical geography, there is an increase of 0.37% in wage/income gap percentage.
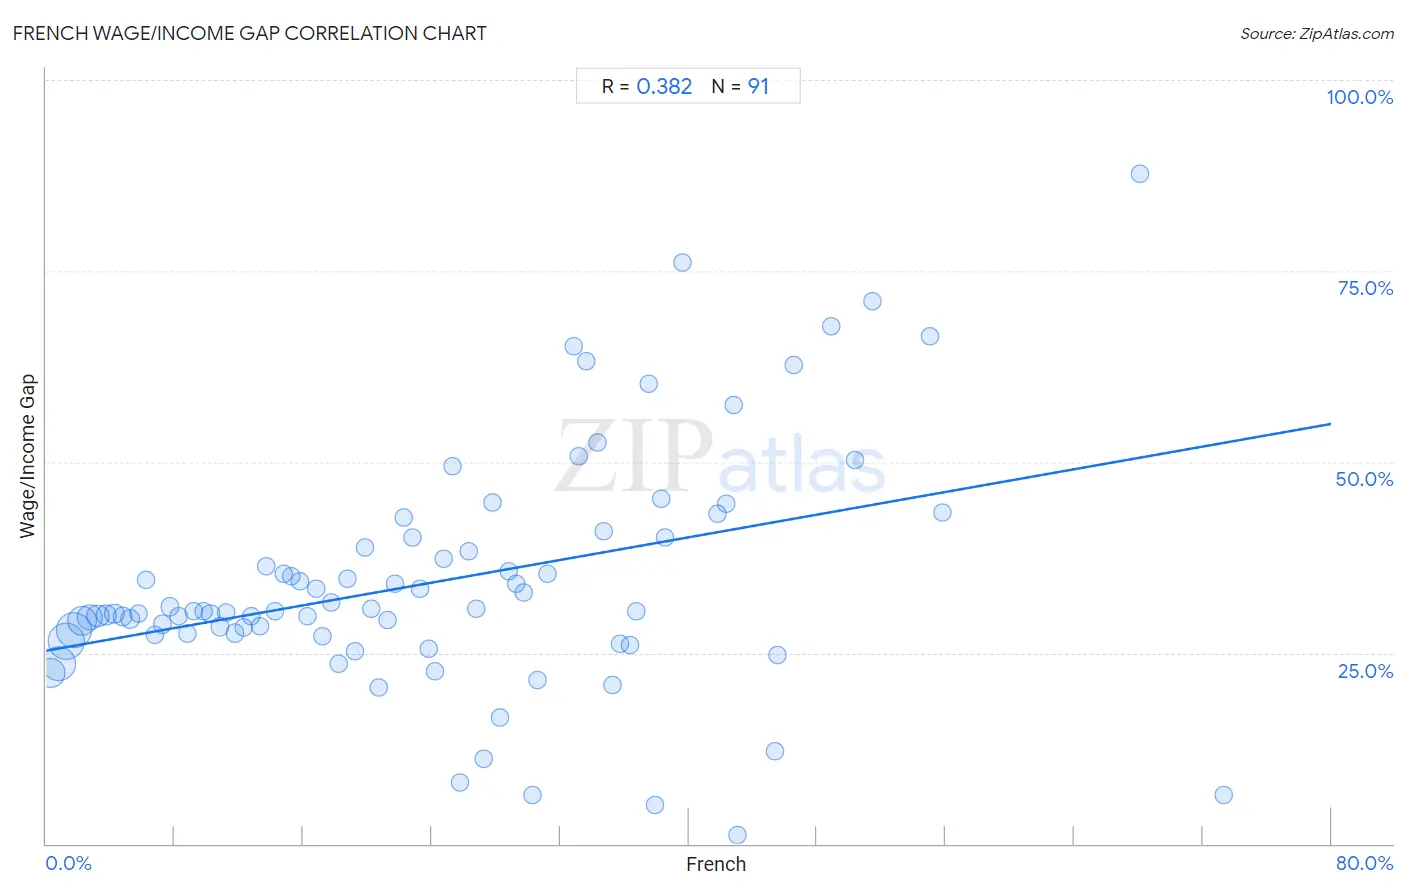
It is essential to understand that the correlation between the percentage of French and wage/income gap percentage does not imply a direct cause-and-effect relationship. It remains uncertain whether the presence of French influences an upward or downward trend in the level of wage/income gap percentage within an area, or if French simply ended up residing in those areas with higher or lower levels of wage/income gap percentage due to other factors.
Demographics Similar to French by Wage/Income Gap
In terms of wage/income gap, the demographic groups most similar to French are Eastern European (28.6%, a difference of 0.13%), Immigrants from Scotland (28.7%, a difference of 0.15%), Maltese (28.7%, a difference of 0.19%), Lithuanian (28.7%, a difference of 0.20%), and Immigrants from Lithuania (28.6%, a difference of 0.26%).
| Demographics | Rating | Rank | Wage/Income Gap |
| Whites/Caucasians | 0.1 /100 | #306 | Tragic 28.5% |
| Immigrants from Denmark | 0.1 /100 | #307 | Tragic 28.5% |
| Poles | 0.1 /100 | #308 | Tragic 28.5% |
| Macedonians | 0.1 /100 | #309 | Tragic 28.6% |
| Finns | 0.1 /100 | #310 | Tragic 28.6% |
| Immigrants from Lithuania | 0.1 /100 | #311 | Tragic 28.6% |
| Eastern Europeans | 0.1 /100 | #312 | Tragic 28.6% |
| French | 0.1 /100 | #313 | Tragic 28.7% |
| Immigrants from Scotland | 0.1 /100 | #314 | Tragic 28.7% |
| Maltese | 0.1 /100 | #315 | Tragic 28.7% |
| Lithuanians | 0.1 /100 | #316 | Tragic 28.7% |
| Belgians | 0.1 /100 | #317 | Tragic 28.8% |
| Basques | 0.1 /100 | #318 | Tragic 28.8% |
| Slovaks | 0.1 /100 | #319 | Tragic 28.9% |
| British | 0.1 /100 | #320 | Tragic 28.9% |
French Wage/Income Gap Correlation Summary
| Measurement | French Data | Wage/Income Gap Data |
| Minimum | 0.26% | 1.1% |
| Maximum | 73.3% | 87.7% |
| Range | 73.1% | 86.6% |
| Mean | 24.3% | 34.3% |
| Median | 22.8% | 30.5% |
| Interquartile 25% (IQ1) | 11.2% | 27.4% |
| Interquartile 75% (IQ3) | 35.2% | 40.1% |
| Interquartile Range (IQR) | 24.0% | 12.7% |
| Standard Deviation (Sample) | 15.9% | 15.5% |
| Standard Deviation (Population) | 15.8% | 15.4% |
Correlation Details
| French Percentile | Sample Size | Wage/Income Gap |
[ 0.0% - 0.5% ] 0.26% | 61,244,437 | 22.3% |
[ 0.5% - 1.0% ] 0.77% | 96,692,529 | 23.6% |
[ 1.0% - 1.5% ] 1.25% | 110,696,445 | 26.5% |
[ 1.5% - 2.0% ] 1.74% | 101,220,172 | 28.0% |
[ 2.0% - 2.5% ] 2.24% | 71,353,238 | 29.2% |
[ 2.5% - 3.0% ] 2.72% | 46,625,170 | 29.6% |
[ 3.0% - 3.5% ] 3.22% | 25,955,856 | 29.8% |
[ 3.5% - 4.0% ] 3.72% | 14,548,154 | 30.0% |
[ 4.0% - 4.5% ] 4.24% | 8,683,731 | 30.1% |
[ 4.5% - 5.0% ] 4.75% | 5,666,934 | 29.8% |
[ 5.0% - 5.5% ] 5.23% | 4,634,147 | 29.4% |
[ 5.5% - 6.0% ] 5.74% | 2,751,101 | 30.2% |
[ 6.0% - 6.5% ] 6.23% | 1,705,834 | 34.6% |
[ 6.5% - 7.0% ] 6.75% | 1,692,640 | 27.4% |
[ 7.0% - 7.5% ] 7.26% | 1,265,615 | 28.7% |
[ 7.5% - 8.0% ] 7.72% | 1,241,753 | 31.0% |
[ 8.0% - 8.5% ] 8.23% | 1,228,768 | 29.9% |
[ 8.5% - 9.0% ] 8.76% | 1,022,843 | 27.5% |
[ 9.0% - 9.5% ] 9.21% | 1,094,964 | 30.5% |
[ 9.5% - 10.0% ] 9.78% | 1,015,559 | 30.5% |
[ 10.0% - 10.5% ] 10.23% | 710,502 | 30.1% |
[ 10.5% - 11.0% ] 10.81% | 1,111,665 | 28.4% |
[ 11.0% - 11.5% ] 11.24% | 431,958 | 30.2% |
[ 11.5% - 12.0% ] 11.75% | 417,358 | 27.6% |
[ 12.0% - 12.5% ] 12.26% | 610,170 | 28.3% |
[ 12.5% - 13.0% ] 12.76% | 579,777 | 29.8% |
[ 13.0% - 13.5% ] 13.29% | 676,450 | 28.4% |
[ 13.5% - 14.0% ] 13.70% | 491,761 | 36.4% |
[ 14.0% - 14.5% ] 14.24% | 564,188 | 30.4% |
[ 14.5% - 15.0% ] 14.76% | 340,940 | 35.3% |
[ 15.0% - 15.5% ] 15.27% | 444,446 | 35.0% |
[ 15.5% - 16.0% ] 15.79% | 313,965 | 34.4% |
[ 16.0% - 16.5% ] 16.24% | 471,907 | 29.8% |
[ 16.5% - 17.0% ] 16.81% | 330,024 | 33.4% |
[ 17.0% - 17.5% ] 17.23% | 165,459 | 27.2% |
[ 17.5% - 18.0% ] 17.78% | 287,473 | 31.6% |
[ 18.0% - 18.5% ] 18.20% | 175,031 | 23.6% |
[ 18.5% - 19.0% ] 18.76% | 56,553 | 34.7% |
[ 19.0% - 19.5% ] 19.25% | 79,355 | 25.3% |
[ 19.5% - 20.0% ] 19.81% | 151,271 | 38.8% |
[ 20.0% - 20.5% ] 20.22% | 46,725 | 30.8% |
[ 20.5% - 21.0% ] 20.72% | 131,591 | 20.5% |
[ 21.0% - 21.5% ] 21.27% | 79,507 | 29.3% |
[ 21.5% - 22.0% ] 21.68% | 69,331 | 34.0% |
[ 22.0% - 22.5% ] 22.28% | 61,006 | 42.7% |
[ 22.5% - 23.0% ] 22.77% | 61,948 | 40.1% |
[ 23.0% - 23.5% ] 23.26% | 86,300 | 33.4% |
[ 23.5% - 24.0% ] 23.78% | 46,332 | 25.6% |
[ 24.0% - 24.5% ] 24.22% | 29,022 | 22.5% |
[ 24.5% - 25.0% ] 24.74% | 18,765 | 37.4% |
[ 25.0% - 25.5% ] 25.29% | 10,761 | 49.5% |
[ 25.5% - 26.0% ] 25.73% | 6,585 | 8.0% |
[ 26.0% - 26.5% ] 26.29% | 16,826 | 38.3% |
[ 26.5% - 27.0% ] 26.76% | 3,804 | 30.7% |
[ 27.0% - 27.5% ] 27.25% | 25,631 | 11.1% |
[ 27.5% - 28.0% ] 27.79% | 19,382 | 44.7% |
[ 28.0% - 28.5% ] 28.29% | 15,326 | 16.5% |
[ 28.5% - 29.0% ] 28.79% | 7,556 | 35.7% |
[ 29.0% - 29.5% ] 29.28% | 19,740 | 34.0% |
[ 29.5% - 30.0% ] 29.72% | 8,547 | 32.9% |
[ 30.0% - 30.5% ] 30.29% | 2,123 | 6.4% |
[ 30.5% - 31.0% ] 30.58% | 5,219 | 21.4% |
[ 31.0% - 31.5% ] 31.24% | 7,062 | 35.4% |
[ 32.5% - 33.0% ] 32.86% | 2,617 | 65.1% |
[ 33.0% - 33.5% ] 33.16% | 3,417 | 50.8% |
[ 33.5% - 34.0% ] 33.61% | 854 | 63.2% |
[ 34.0% - 34.5% ] 34.29% | 1,782 | 52.5% |
[ 34.5% - 35.0% ] 34.69% | 8,236 | 41.0% |
[ 35.0% - 35.5% ] 35.24% | 1,430 | 20.7% |
[ 35.5% - 36.0% ] 35.76% | 1,046 | 26.2% |
[ 36.0% - 36.5% ] 36.31% | 2,702 | 26.1% |
[ 36.5% - 37.0% ] 36.70% | 4,741 | 30.5% |
[ 37.0% - 37.5% ] 37.50% | 3,523 | 60.2% |
[ 37.5% - 38.0% ] 37.87% | 375 | 5.0% |
[ 38.0% - 38.5% ] 38.27% | 3,904 | 45.2% |
[ 38.5% - 39.0% ] 38.55% | 1,406 | 40.1% |
[ 39.5% - 40.0% ] 39.57% | 374 | 76.2% |
[ 41.5% - 42.0% ] 41.78% | 1,089 | 43.2% |
[ 42.0% - 42.5% ] 42.33% | 626 | 44.5% |
[ 42.5% - 43.0% ] 42.76% | 1,527 | 57.5% |
[ 43.0% - 43.5% ] 43.06% | 346 | 1.1% |
[ 45.0% - 45.5% ] 45.38% | 260 | 12.2% |
[ 45.5% - 46.0% ] 45.54% | 303 | 24.7% |
[ 46.5% - 47.0% ] 46.51% | 43 | 62.7% |
[ 48.5% - 49.0% ] 48.84% | 86 | 67.8% |
[ 50.0% - 50.5% ] 50.38% | 1,046 | 50.2% |
[ 51.0% - 51.5% ] 51.42% | 1,474 | 71.1% |
[ 55.0% - 55.5% ] 55.05% | 218 | 66.5% |
[ 55.5% - 56.0% ] 55.80% | 1,353 | 43.4% |
[ 68.0% - 68.5% ] 68.06% | 72 | 87.7% |
[ 73.0% - 73.5% ] 73.33% | 225 | 6.4% |