French Married-Couple Family Poverty
COMPARE
French
Select to Compare
Married-Couple Family Poverty
French Married-Couple Family Poverty
4.3%
POVERTY | MARRIED-COUPLE FAMILIES
99.7/ 100
METRIC RATING
55th/ 347
METRIC RANK
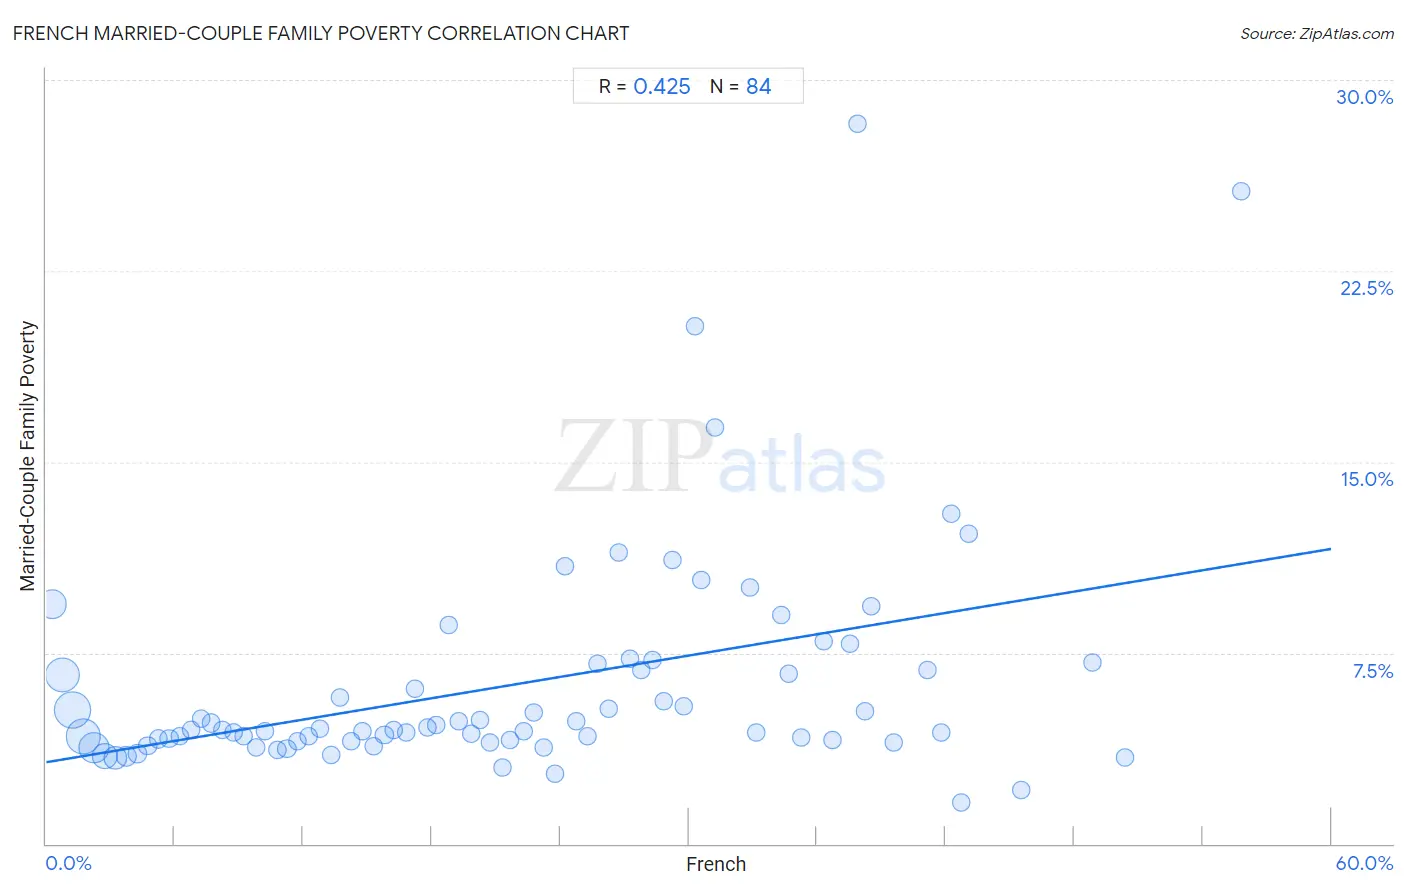
French Married-Couple Family Poverty Correlation Chart
The statistical analysis conducted on geographies consisting of 557,631,168 people shows a moderate positive correlation between the proportion of French and poverty level among married-couple families in the United States with a correlation coefficient (R) of 0.425 and weighted average of 4.3%. On average, for every 1% (one percent) increase in French within a typical geography, there is an increase of 0.14% in poverty level among married-couple families.
It is essential to understand that the correlation between the percentage of French and poverty level among married-couple families does not imply a direct cause-and-effect relationship. It remains uncertain whether the presence of French influences an upward or downward trend in the level of poverty level among married-couple families within an area, or if French simply ended up residing in those areas with higher or lower levels of poverty level among married-couple families due to other factors.
Demographics Similar to French by Married-Couple Family Poverty
In terms of married-couple family poverty, the demographic groups most similar to French are Austrian (4.3%, a difference of 0.020%), Immigrants from Zimbabwe (4.3%, a difference of 0.16%), Immigrants from Netherlands (4.3%, a difference of 0.16%), Czechoslovakian (4.4%, a difference of 0.24%), and Welsh (4.3%, a difference of 0.29%).
| Demographics | Rating | Rank | Married-Couple Family Poverty |
| Australians | 99.7 /100 | #48 | Exceptional 4.3% |
| Turks | 99.7 /100 | #49 | Exceptional 4.3% |
| Burmese | 99.7 /100 | #50 | Exceptional 4.3% |
| Immigrants from Lithuania | 99.7 /100 | #51 | Exceptional 4.3% |
| Russians | 99.7 /100 | #52 | Exceptional 4.3% |
| Welsh | 99.7 /100 | #53 | Exceptional 4.3% |
| Austrians | 99.7 /100 | #54 | Exceptional 4.3% |
| French | 99.7 /100 | #55 | Exceptional 4.3% |
| Immigrants from Zimbabwe | 99.7 /100 | #56 | Exceptional 4.3% |
| Immigrants from Netherlands | 99.7 /100 | #57 | Exceptional 4.3% |
| Czechoslovakians | 99.7 /100 | #58 | Exceptional 4.4% |
| Immigrants from Sweden | 99.6 /100 | #59 | Exceptional 4.4% |
| Tlingit-Haida | 99.6 /100 | #60 | Exceptional 4.4% |
| Okinawans | 99.6 /100 | #61 | Exceptional 4.4% |
| Immigrants from Australia | 99.6 /100 | #62 | Exceptional 4.4% |
French Married-Couple Family Poverty Correlation Summary
| Measurement | French Data | Married-Couple Family Poverty Data |
| Minimum | 0.26% | 1.6% |
| Maximum | 55.8% | 28.3% |
| Range | 55.5% | 26.7% |
| Mean | 21.9% | 6.3% |
| Median | 21.0% | 4.5% |
| Interquartile 25% (IQ1) | 10.5% | 4.0% |
| Interquartile 75% (IQ3) | 32.0% | 6.9% |
| Interquartile Range (IQR) | 21.5% | 2.9% |
| Standard Deviation (Sample) | 13.6% | 4.5% |
| Standard Deviation (Population) | 13.6% | 4.5% |
Correlation Details
| French Percentile | Sample Size | Married-Couple Family Poverty |
[ 0.0% - 0.5% ] 0.26% | 60,204,557 | 9.4% |
[ 0.5% - 1.0% ] 0.77% | 95,110,546 | 6.6% |
[ 1.0% - 1.5% ] 1.25% | 109,013,368 | 5.3% |
[ 1.5% - 2.0% ] 1.74% | 99,663,196 | 4.2% |
[ 2.0% - 2.5% ] 2.24% | 69,957,880 | 3.8% |
[ 2.5% - 3.0% ] 2.72% | 45,634,066 | 3.5% |
[ 3.0% - 3.5% ] 3.22% | 25,323,088 | 3.4% |
[ 3.5% - 4.0% ] 3.72% | 13,960,771 | 3.4% |
[ 4.0% - 4.5% ] 4.24% | 8,424,231 | 3.5% |
[ 4.5% - 5.0% ] 4.75% | 5,269,703 | 3.8% |
[ 5.0% - 5.5% ] 5.23% | 4,358,532 | 4.1% |
[ 5.5% - 6.0% ] 5.74% | 2,614,490 | 4.1% |
[ 6.0% - 6.5% ] 6.23% | 1,494,299 | 4.2% |
[ 6.5% - 7.0% ] 6.74% | 1,583,953 | 4.5% |
[ 7.0% - 7.5% ] 7.25% | 1,195,451 | 4.9% |
[ 7.5% - 8.0% ] 7.72% | 1,105,613 | 4.7% |
[ 8.0% - 8.5% ] 8.23% | 1,146,276 | 4.5% |
[ 8.5% - 9.0% ] 8.76% | 913,540 | 4.4% |
[ 9.0% - 9.5% ] 9.20% | 1,042,304 | 4.2% |
[ 9.5% - 10.0% ] 9.78% | 937,884 | 3.8% |
[ 10.0% - 10.5% ] 10.23% | 659,515 | 4.4% |
[ 10.5% - 11.0% ] 10.81% | 1,059,162 | 3.7% |
[ 11.0% - 11.5% ] 11.23% | 400,919 | 3.7% |
[ 11.5% - 12.0% ] 11.76% | 386,450 | 4.0% |
[ 12.0% - 12.5% ] 12.26% | 564,482 | 4.2% |
[ 12.5% - 13.0% ] 12.77% | 551,041 | 4.5% |
[ 13.0% - 13.5% ] 13.29% | 626,528 | 3.5% |
[ 13.5% - 14.0% ] 13.70% | 450,459 | 5.7% |
[ 14.0% - 14.5% ] 14.23% | 538,196 | 4.0% |
[ 14.5% - 15.0% ] 14.76% | 296,404 | 4.4% |
[ 15.0% - 15.5% ] 15.27% | 439,113 | 3.9% |
[ 15.5% - 16.0% ] 15.79% | 297,437 | 4.3% |
[ 16.0% - 16.5% ] 16.24% | 443,316 | 4.5% |
[ 16.5% - 17.0% ] 16.81% | 326,306 | 4.4% |
[ 17.0% - 17.5% ] 17.21% | 147,942 | 6.1% |
[ 17.5% - 18.0% ] 17.78% | 279,816 | 4.6% |
[ 18.0% - 18.5% ] 18.20% | 169,635 | 4.7% |
[ 18.5% - 19.0% ] 18.78% | 52,706 | 8.6% |
[ 19.0% - 19.5% ] 19.25% | 79,553 | 4.8% |
[ 19.5% - 20.0% ] 19.82% | 138,147 | 4.3% |
[ 20.0% - 20.5% ] 20.25% | 45,223 | 4.9% |
[ 20.5% - 21.0% ] 20.71% | 119,059 | 4.0% |
[ 21.0% - 21.5% ] 21.28% | 69,101 | 3.0% |
[ 21.5% - 22.0% ] 21.68% | 66,929 | 4.1% |
[ 22.0% - 22.5% ] 22.28% | 59,533 | 4.4% |
[ 22.5% - 23.0% ] 22.76% | 56,189 | 5.2% |
[ 23.0% - 23.5% ] 23.25% | 88,721 | 3.8% |
[ 23.5% - 24.0% ] 23.78% | 46,162 | 2.7% |
[ 24.0% - 24.5% ] 24.21% | 27,142 | 10.9% |
[ 24.5% - 25.0% ] 24.75% | 13,553 | 4.8% |
[ 25.0% - 25.5% ] 25.29% | 16,415 | 4.2% |
[ 25.5% - 26.0% ] 25.73% | 7,323 | 7.0% |
[ 26.0% - 26.5% ] 26.29% | 16,719 | 5.3% |
[ 26.5% - 27.0% ] 26.71% | 3,759 | 11.5% |
[ 27.0% - 27.5% ] 27.24% | 24,967 | 7.3% |
[ 27.5% - 28.0% ] 27.80% | 19,338 | 6.8% |
[ 28.0% - 28.5% ] 28.29% | 15,715 | 7.2% |
[ 28.5% - 29.0% ] 28.81% | 7,439 | 5.6% |
[ 29.0% - 29.5% ] 29.24% | 15,204 | 11.2% |
[ 29.5% - 30.0% ] 29.74% | 2,098 | 5.4% |
[ 30.0% - 30.5% ] 30.26% | 2,617 | 20.3% |
[ 30.5% - 31.0% ] 30.59% | 4,868 | 10.4% |
[ 31.0% - 31.5% ] 31.21% | 1,868 | 16.3% |
[ 32.5% - 33.0% ] 32.86% | 3,567 | 10.0% |
[ 33.0% - 33.5% ] 33.16% | 2,515 | 4.4% |
[ 34.0% - 34.5% ] 34.34% | 1,488 | 9.0% |
[ 34.5% - 35.0% ] 34.69% | 8,236 | 6.7% |
[ 35.0% - 35.5% ] 35.26% | 1,730 | 4.2% |
[ 36.0% - 36.5% ] 36.31% | 2,286 | 7.9% |
[ 36.5% - 37.0% ] 36.70% | 4,741 | 4.1% |
[ 37.0% - 37.5% ] 37.50% | 3,208 | 7.9% |
[ 37.5% - 38.0% ] 37.87% | 375 | 28.3% |
[ 38.0% - 38.5% ] 38.21% | 3,606 | 5.2% |
[ 38.5% - 39.0% ] 38.55% | 1,170 | 9.3% |
[ 39.5% - 40.0% ] 39.57% | 374 | 4.0% |
[ 41.0% - 41.5% ] 41.14% | 1,490 | 6.8% |
[ 41.5% - 42.0% ] 41.79% | 201 | 4.3% |
[ 42.0% - 42.5% ] 42.23% | 959 | 13.0% |
[ 42.5% - 43.0% ] 42.72% | 1,271 | 1.6% |
[ 43.0% - 43.5% ] 43.06% | 346 | 12.2% |
[ 45.5% - 46.0% ] 45.54% | 303 | 2.1% |
[ 48.5% - 49.0% ] 48.84% | 86 | 7.1% |
[ 50.0% - 50.5% ] 50.38% | 1,046 | 3.4% |
[ 55.5% - 56.0% ] 55.80% | 1,353 | 25.6% |