French Disability
COMPARE
French
Select to Compare
Disability
French Disability
13.2%
DISABILITY
0.0/ 100
METRIC RATING
299th/ 347
METRIC RANK
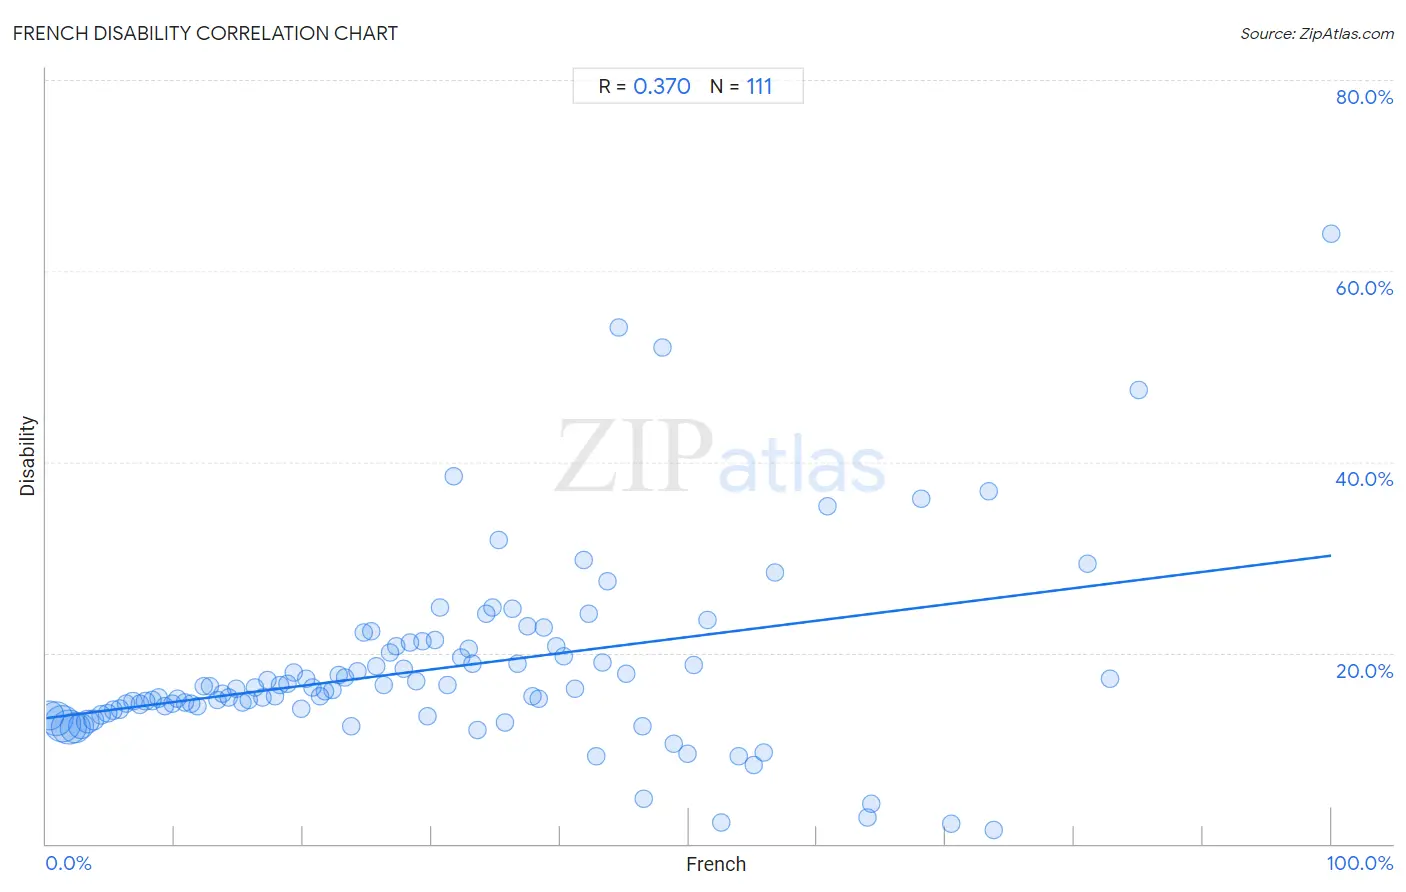
French Disability Correlation Chart
The statistical analysis conducted on geographies consisting of 572,283,731 people shows a mild positive correlation between the proportion of French and percentage of population with a disability in the United States with a correlation coefficient (R) of 0.370 and weighted average of 13.2%. On average, for every 1% (one percent) increase in French within a typical geography, there is an increase of 0.17% in percentage of population with a disability.
It is essential to understand that the correlation between the percentage of French and percentage of population with a disability does not imply a direct cause-and-effect relationship. It remains uncertain whether the presence of French influences an upward or downward trend in the level of percentage of population with a disability within an area, or if French simply ended up residing in those areas with higher or lower levels of percentage of population with a disability due to other factors.
Demographics Similar to French by Disability
In terms of disability, the demographic groups most similar to French are Alaska Native (13.2%, a difference of 0.020%), Hopi (13.2%, a difference of 0.030%), Pennsylvania German (13.2%, a difference of 0.050%), Central American Indian (13.2%, a difference of 0.080%), and Nonimmigrants (13.2%, a difference of 0.12%).
| Demographics | Rating | Rank | Disability |
| Aleuts | 0.0 /100 | #292 | Tragic 13.1% |
| Marshallese | 0.0 /100 | #293 | Tragic 13.1% |
| Celtics | 0.0 /100 | #294 | Tragic 13.1% |
| Nonimmigrants | 0.0 /100 | #295 | Tragic 13.2% |
| Central American Indians | 0.0 /100 | #296 | Tragic 13.2% |
| Hopi | 0.0 /100 | #297 | Tragic 13.2% |
| Alaska Natives | 0.0 /100 | #298 | Tragic 13.2% |
| French | 0.0 /100 | #299 | Tragic 13.2% |
| Pennsylvania Germans | 0.0 /100 | #300 | Tragic 13.2% |
| Immigrants from Micronesia | 0.0 /100 | #301 | Tragic 13.2% |
| Arapaho | 0.0 /100 | #302 | Tragic 13.2% |
| Scotch-Irish | 0.0 /100 | #303 | Tragic 13.3% |
| Yakama | 0.0 /100 | #304 | Tragic 13.4% |
| French Canadians | 0.0 /100 | #305 | Tragic 13.4% |
| Cape Verdeans | 0.0 /100 | #306 | Tragic 13.5% |
French Disability Correlation Summary
| Measurement | French Data | Disability Data |
| Minimum | 0.26% | 1.5% |
| Maximum | 100.0% | 63.9% |
| Range | 99.7% | 62.4% |
| Mean | 30.5% | 18.3% |
| Median | 27.8% | 16.2% |
| Interquartile 25% (IQ1) | 13.7% | 13.9% |
| Interquartile 75% (IQ3) | 42.8% | 20.7% |
| Interquartile Range (IQR) | 29.0% | 6.7% |
| Standard Deviation (Sample) | 21.1% | 9.7% |
| Standard Deviation (Population) | 21.0% | 9.7% |
Correlation Details
| French Percentile | Sample Size | Disability |
[ 0.0% - 0.5% ] 0.26% | 61,557,866 | 13.5% |
[ 0.5% - 1.0% ] 0.77% | 97,096,845 | 13.1% |
[ 1.0% - 1.5% ] 1.25% | 111,018,490 | 12.5% |
[ 1.5% - 2.0% ] 1.74% | 101,456,661 | 12.2% |
[ 2.0% - 2.5% ] 2.24% | 71,562,713 | 12.2% |
[ 2.5% - 3.0% ] 2.72% | 46,784,427 | 12.3% |
[ 3.0% - 3.5% ] 3.22% | 26,102,175 | 12.8% |
[ 3.5% - 4.0% ] 3.72% | 14,658,175 | 13.0% |
[ 4.0% - 4.5% ] 4.24% | 8,797,891 | 13.5% |
[ 4.5% - 5.0% ] 4.75% | 5,740,839 | 13.7% |
[ 5.0% - 5.5% ] 5.23% | 4,685,234 | 13.9% |
[ 5.5% - 6.0% ] 5.74% | 2,809,265 | 14.1% |
[ 6.0% - 6.5% ] 6.23% | 1,745,590 | 14.6% |
[ 6.5% - 7.0% ] 6.75% | 1,726,622 | 15.0% |
[ 7.0% - 7.5% ] 7.26% | 1,310,984 | 14.6% |
[ 7.5% - 8.0% ] 7.72% | 1,272,500 | 14.9% |
[ 8.0% - 8.5% ] 8.23% | 1,260,594 | 15.0% |
[ 8.5% - 9.0% ] 8.76% | 1,045,789 | 15.3% |
[ 9.0% - 9.5% ] 9.21% | 1,118,665 | 14.4% |
[ 9.5% - 10.0% ] 9.78% | 1,033,144 | 14.6% |
[ 10.0% - 10.5% ] 10.23% | 722,630 | 15.2% |
[ 10.5% - 11.0% ] 10.80% | 1,128,126 | 14.8% |
[ 11.0% - 11.5% ] 11.24% | 445,948 | 14.7% |
[ 11.5% - 12.0% ] 11.75% | 425,697 | 14.4% |
[ 12.0% - 12.5% ] 12.26% | 619,068 | 16.5% |
[ 12.5% - 13.0% ] 12.76% | 597,790 | 16.5% |
[ 13.0% - 13.5% ] 13.29% | 687,059 | 15.1% |
[ 13.5% - 14.0% ] 13.71% | 499,090 | 15.7% |
[ 14.0% - 14.5% ] 14.24% | 575,547 | 15.3% |
[ 14.5% - 15.0% ] 14.76% | 347,339 | 16.2% |
[ 15.0% - 15.5% ] 15.27% | 457,768 | 14.8% |
[ 15.5% - 16.0% ] 15.79% | 323,159 | 15.1% |
[ 16.0% - 16.5% ] 16.24% | 477,761 | 16.4% |
[ 16.5% - 17.0% ] 16.80% | 339,578 | 15.4% |
[ 17.0% - 17.5% ] 17.24% | 171,344 | 17.1% |
[ 17.5% - 18.0% ] 17.78% | 292,157 | 15.4% |
[ 18.0% - 18.5% ] 18.20% | 180,802 | 16.6% |
[ 18.5% - 19.0% ] 18.76% | 63,039 | 16.7% |
[ 19.0% - 19.5% ] 19.25% | 83,072 | 17.9% |
[ 19.5% - 20.0% ] 19.81% | 154,552 | 14.2% |
[ 20.0% - 20.5% ] 20.24% | 57,825 | 17.3% |
[ 20.5% - 21.0% ] 20.73% | 138,689 | 16.4% |
[ 21.0% - 21.5% ] 21.27% | 83,329 | 15.5% |
[ 21.5% - 22.0% ] 21.69% | 72,264 | 15.9% |
[ 22.0% - 22.5% ] 22.28% | 62,456 | 16.1% |
[ 22.5% - 23.0% ] 22.77% | 64,245 | 17.7% |
[ 23.0% - 23.5% ] 23.26% | 90,366 | 17.4% |
[ 23.5% - 24.0% ] 23.78% | 48,638 | 12.3% |
[ 24.0% - 24.5% ] 24.22% | 35,013 | 18.1% |
[ 24.5% - 25.0% ] 24.75% | 19,979 | 22.1% |
[ 25.0% - 25.5% ] 25.29% | 16,831 | 22.3% |
[ 25.5% - 26.0% ] 25.73% | 7,397 | 18.6% |
[ 26.0% - 26.5% ] 26.25% | 20,844 | 16.7% |
[ 26.5% - 27.0% ] 26.77% | 7,414 | 20.0% |
[ 27.0% - 27.5% ] 27.25% | 28,604 | 20.7% |
[ 27.5% - 28.0% ] 27.79% | 21,220 | 18.3% |
[ 28.0% - 28.5% ] 28.28% | 16,541 | 21.1% |
[ 28.5% - 29.0% ] 28.79% | 8,785 | 17.1% |
[ 29.0% - 29.5% ] 29.28% | 20,020 | 21.3% |
[ 29.5% - 30.0% ] 29.72% | 8,611 | 13.4% |
[ 30.0% - 30.5% ] 30.24% | 3,809 | 21.3% |
[ 30.5% - 31.0% ] 30.61% | 5,822 | 24.7% |
[ 31.0% - 31.5% ] 31.23% | 7,809 | 16.6% |
[ 31.5% - 32.0% ] 31.76% | 148 | 38.5% |
[ 32.0% - 32.5% ] 32.25% | 524 | 19.5% |
[ 32.5% - 33.0% ] 32.86% | 3,947 | 20.4% |
[ 33.0% - 33.5% ] 33.19% | 4,140 | 18.8% |
[ 33.5% - 34.0% ] 33.60% | 997 | 11.9% |
[ 34.0% - 34.5% ] 34.29% | 1,782 | 24.1% |
[ 34.5% - 35.0% ] 34.69% | 8,359 | 24.8% |
[ 35.0% - 35.5% ] 35.24% | 1,938 | 31.9% |
[ 35.5% - 36.0% ] 35.73% | 1,198 | 12.7% |
[ 36.0% - 36.5% ] 36.31% | 2,713 | 24.6% |
[ 36.5% - 37.0% ] 36.70% | 4,741 | 18.9% |
[ 37.0% - 37.5% ] 37.48% | 3,685 | 22.8% |
[ 37.5% - 38.0% ] 37.87% | 375 | 15.5% |
[ 38.0% - 38.5% ] 38.30% | 5,841 | 15.2% |
[ 38.5% - 39.0% ] 38.69% | 3,027 | 22.6% |
[ 39.5% - 40.0% ] 39.67% | 1,346 | 20.8% |
[ 40.0% - 40.5% ] 40.32% | 888 | 19.6% |
[ 41.0% - 41.5% ] 41.16% | 1,805 | 16.2% |
[ 41.5% - 42.0% ] 41.79% | 1,352 | 29.7% |
[ 42.0% - 42.5% ] 42.23% | 959 | 24.1% |
[ 42.5% - 43.0% ] 42.75% | 1,663 | 9.1% |
[ 43.0% - 43.5% ] 43.32% | 1,295 | 19.0% |
[ 43.5% - 44.0% ] 43.66% | 284 | 27.5% |
[ 44.5% - 45.0% ] 44.59% | 222 | 54.1% |
[ 45.0% - 45.5% ] 45.15% | 1,165 | 17.9% |
[ 46.0% - 46.5% ] 46.39% | 97 | 12.4% |
[ 46.5% - 47.0% ] 46.51% | 43 | 4.7% |
[ 48.0% - 48.5% ] 48.00% | 25 | 52.0% |
[ 48.5% - 49.0% ] 48.84% | 86 | 10.5% |
[ 49.5% - 50.0% ] 49.90% | 497 | 9.5% |
[ 50.0% - 50.5% ] 50.39% | 1,153 | 18.7% |
[ 51.0% - 51.5% ] 51.42% | 1,474 | 23.5% |
[ 52.5% - 53.0% ] 52.51% | 219 | 2.3% |
[ 53.5% - 54.0% ] 53.85% | 65 | 9.2% |
[ 55.0% - 55.5% ] 55.05% | 218 | 8.3% |
[ 55.5% - 56.0% ] 55.80% | 1,353 | 9.6% |
[ 56.5% - 57.0% ] 56.72% | 67 | 28.4% |
[ 60.5% - 61.0% ] 60.77% | 130 | 35.4% |
[ 63.5% - 64.0% ] 63.89% | 180 | 2.8% |
[ 64.0% - 64.5% ] 64.21% | 95 | 4.2% |
[ 68.0% - 68.5% ] 68.06% | 72 | 36.1% |
[ 70.0% - 70.5% ] 70.45% | 335 | 2.1% |
[ 73.0% - 73.5% ] 73.33% | 225 | 36.9% |
[ 73.5% - 74.0% ] 73.72% | 137 | 1.5% |
[ 81.0% - 81.5% ] 81.03% | 116 | 29.3% |
[ 82.5% - 83.0% ] 82.74% | 168 | 17.3% |
[ 85.0% - 85.5% ] 85.00% | 40 | 47.5% |
[ 99.5% - 100.0% ] 100.00% | 36 | 63.9% |