French Male Disability
COMPARE
French
Select to Compare
Male Disability
French Male Disability
13.0%
DISABILITY | MALES
0.0/ 100
METRIC RATING
301st/ 347
METRIC RANK
French Male Disability Correlation Chart
The statistical analysis conducted on geographies consisting of 572,141,225 people shows a moderate positive correlation between the proportion of French and percentage of males with a disability in the United States with a correlation coefficient (R) of 0.463 and weighted average of 13.0%. On average, for every 1% (one percent) increase in French within a typical geography, there is an increase of 0.30% in percentage of males with a disability.
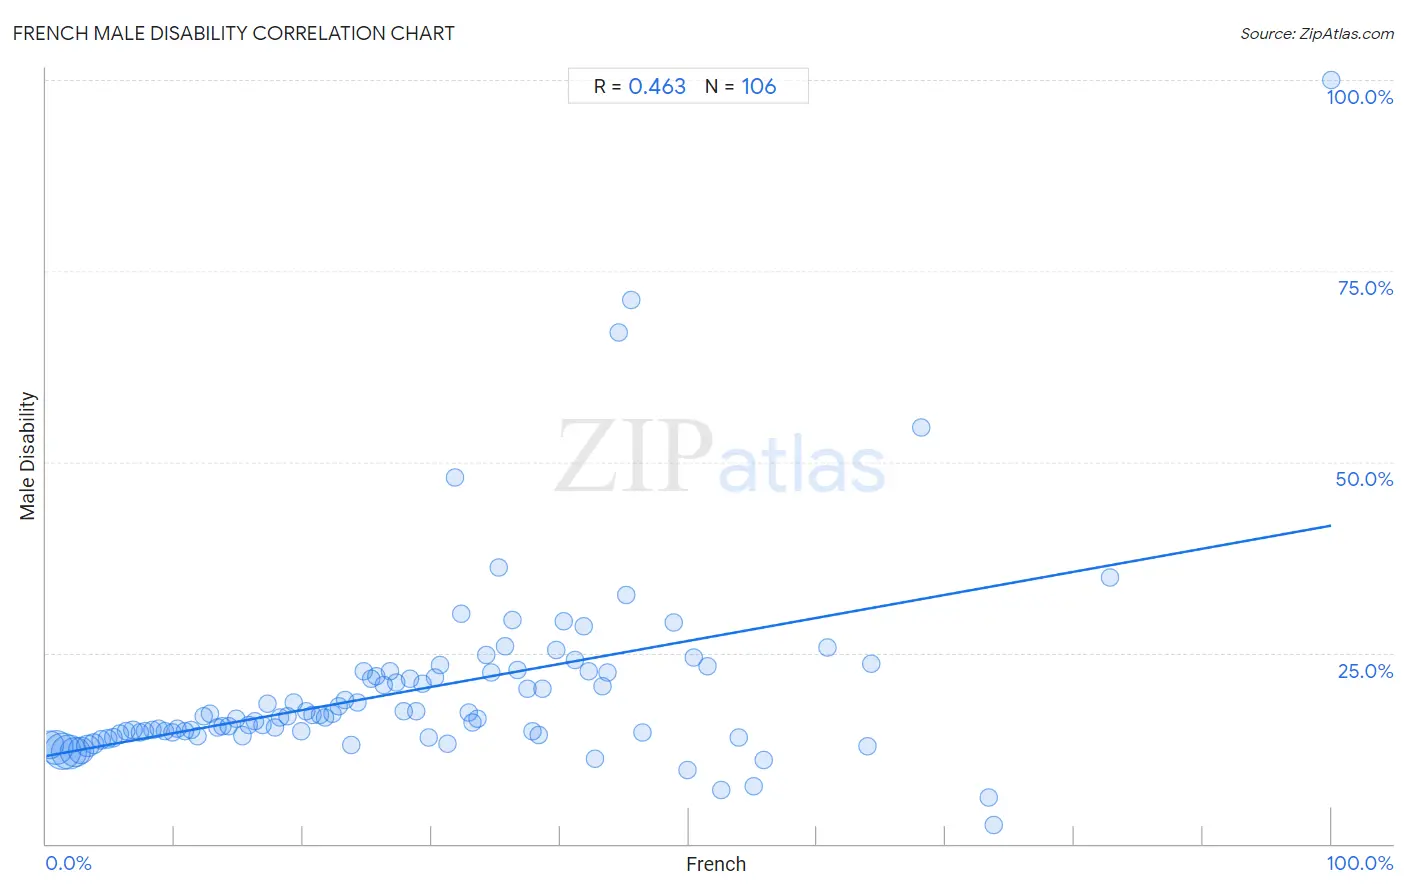
It is essential to understand that the correlation between the percentage of French and percentage of males with a disability does not imply a direct cause-and-effect relationship. It remains uncertain whether the presence of French influences an upward or downward trend in the level of percentage of males with a disability within an area, or if French simply ended up residing in those areas with higher or lower levels of percentage of males with a disability due to other factors.
Demographics Similar to French by Male Disability
In terms of male disability, the demographic groups most similar to French are Cheyenne (13.0%, a difference of 0.040%), Celtic (13.0%, a difference of 0.13%), Pennsylvania German (13.0%, a difference of 0.48%), Crow (13.1%, a difference of 0.58%), and Inupiat (13.0%, a difference of 0.69%).
| Demographics | Rating | Rank | Male Disability |
| Marshallese | 0.0 /100 | #294 | Tragic 12.9% |
| Immigrants from Micronesia | 0.0 /100 | #295 | Tragic 12.9% |
| Nonimmigrants | 0.0 /100 | #296 | Tragic 12.9% |
| Inupiat | 0.0 /100 | #297 | Tragic 13.0% |
| Pennsylvania Germans | 0.0 /100 | #298 | Tragic 13.0% |
| Celtics | 0.0 /100 | #299 | Tragic 13.0% |
| Cheyenne | 0.0 /100 | #300 | Tragic 13.0% |
| French | 0.0 /100 | #301 | Tragic 13.0% |
| Crow | 0.0 /100 | #302 | Tragic 13.1% |
| Scotch-Irish | 0.0 /100 | #303 | Tragic 13.2% |
| Blacks/African Americans | 0.0 /100 | #304 | Tragic 13.2% |
| French Canadians | 0.0 /100 | #305 | Tragic 13.3% |
| Spanish Americans | 0.0 /100 | #306 | Tragic 13.3% |
| Arapaho | 0.0 /100 | #307 | Tragic 13.3% |
| French American Indians | 0.0 /100 | #308 | Tragic 13.4% |
French Male Disability Correlation Summary
| Measurement | French Data | Male Disability Data |
| Minimum | 0.26% | 2.5% |
| Maximum | 100.0% | 100.0% |
| Range | 99.7% | 97.5% |
| Mean | 28.7% | 20.1% |
| Median | 26.5% | 16.6% |
| Interquartile 25% (IQ1) | 13.3% | 14.3% |
| Interquartile 75% (IQ3) | 40.3% | 22.4% |
| Interquartile Range (IQR) | 27.0% | 8.1% |
| Standard Deviation (Sample) | 19.7% | 12.8% |
| Standard Deviation (Population) | 19.6% | 12.8% |
Correlation Details
| French Percentile | Sample Size | Male Disability |
[ 0.0% - 0.5% ] 0.26% | 61,539,806 | 13.0% |
[ 0.5% - 1.0% ] 0.77% | 97,085,124 | 12.6% |
[ 1.0% - 1.5% ] 1.25% | 110,998,992 | 12.2% |
[ 1.5% - 2.0% ] 1.74% | 101,444,674 | 12.0% |
[ 2.0% - 2.5% ] 2.24% | 71,558,846 | 12.0% |
[ 2.5% - 3.0% ] 2.72% | 46,770,029 | 12.2% |
[ 3.0% - 3.5% ] 3.22% | 26,091,078 | 12.8% |
[ 3.5% - 4.0% ] 3.72% | 14,656,192 | 13.0% |
[ 4.0% - 4.5% ] 4.24% | 8,794,046 | 13.6% |
[ 4.5% - 5.0% ] 4.75% | 5,738,732 | 13.7% |
[ 5.0% - 5.5% ] 5.23% | 4,683,323 | 13.9% |
[ 5.5% - 6.0% ] 5.74% | 2,802,646 | 14.3% |
[ 6.0% - 6.5% ] 6.23% | 1,743,898 | 14.7% |
[ 6.5% - 7.0% ] 6.75% | 1,725,782 | 14.9% |
[ 7.0% - 7.5% ] 7.26% | 1,308,568 | 14.6% |
[ 7.5% - 8.0% ] 7.72% | 1,270,259 | 14.8% |
[ 8.0% - 8.5% ] 8.23% | 1,259,454 | 14.9% |
[ 8.5% - 9.0% ] 8.76% | 1,044,473 | 15.1% |
[ 9.0% - 9.5% ] 9.21% | 1,117,619 | 14.7% |
[ 9.5% - 10.0% ] 9.78% | 1,031,628 | 14.5% |
[ 10.0% - 10.5% ] 10.23% | 721,799 | 15.0% |
[ 10.5% - 11.0% ] 10.80% | 1,124,880 | 14.8% |
[ 11.0% - 11.5% ] 11.24% | 444,216 | 14.9% |
[ 11.5% - 12.0% ] 11.75% | 425,395 | 14.0% |
[ 12.0% - 12.5% ] 12.26% | 617,937 | 16.6% |
[ 12.5% - 13.0% ] 12.76% | 597,480 | 17.0% |
[ 13.0% - 13.5% ] 13.29% | 686,219 | 15.2% |
[ 13.5% - 14.0% ] 13.71% | 497,389 | 15.4% |
[ 14.0% - 14.5% ] 14.24% | 573,940 | 15.4% |
[ 14.5% - 15.0% ] 14.76% | 346,666 | 16.3% |
[ 15.0% - 15.5% ] 15.27% | 457,603 | 14.2% |
[ 15.5% - 16.0% ] 15.79% | 323,102 | 15.5% |
[ 16.0% - 16.5% ] 16.24% | 477,329 | 16.0% |
[ 16.5% - 17.0% ] 16.80% | 339,369 | 15.5% |
[ 17.0% - 17.5% ] 17.24% | 171,004 | 18.3% |
[ 17.5% - 18.0% ] 17.78% | 289,633 | 15.2% |
[ 18.0% - 18.5% ] 18.20% | 180,113 | 16.5% |
[ 18.5% - 19.0% ] 18.76% | 62,932 | 16.8% |
[ 19.0% - 19.5% ] 19.25% | 83,072 | 18.5% |
[ 19.5% - 20.0% ] 19.81% | 154,402 | 14.8% |
[ 20.0% - 20.5% ] 20.24% | 57,825 | 17.4% |
[ 20.5% - 21.0% ] 20.73% | 138,689 | 16.9% |
[ 21.0% - 21.5% ] 21.27% | 83,080 | 16.8% |
[ 21.5% - 22.0% ] 21.69% | 71,844 | 16.6% |
[ 22.0% - 22.5% ] 22.28% | 62,456 | 17.0% |
[ 22.5% - 23.0% ] 22.77% | 63,956 | 18.0% |
[ 23.0% - 23.5% ] 23.26% | 90,366 | 18.9% |
[ 23.5% - 24.0% ] 23.78% | 48,638 | 12.9% |
[ 24.0% - 24.5% ] 24.22% | 34,686 | 18.5% |
[ 24.5% - 25.0% ] 24.75% | 19,818 | 22.6% |
[ 25.0% - 25.5% ] 25.29% | 16,831 | 21.6% |
[ 25.5% - 26.0% ] 25.73% | 7,397 | 21.9% |
[ 26.0% - 26.5% ] 26.27% | 19,426 | 20.8% |
[ 26.5% - 27.0% ] 26.77% | 7,414 | 22.5% |
[ 27.0% - 27.5% ] 27.25% | 28,420 | 21.1% |
[ 27.5% - 28.0% ] 27.79% | 21,220 | 17.4% |
[ 28.0% - 28.5% ] 28.28% | 16,541 | 21.6% |
[ 28.5% - 29.0% ] 28.79% | 8,785 | 17.3% |
[ 29.0% - 29.5% ] 29.28% | 20,020 | 21.0% |
[ 29.5% - 30.0% ] 29.72% | 8,547 | 13.8% |
[ 30.0% - 30.5% ] 30.24% | 3,809 | 21.8% |
[ 30.5% - 31.0% ] 30.60% | 5,666 | 23.4% |
[ 31.0% - 31.5% ] 31.23% | 7,809 | 13.0% |
[ 31.5% - 32.0% ] 31.82% | 88 | 48.0% |
[ 32.0% - 32.5% ] 32.25% | 524 | 30.1% |
[ 32.5% - 33.0% ] 32.86% | 3,947 | 17.1% |
[ 33.0% - 33.5% ] 33.19% | 4,140 | 15.8% |
[ 33.5% - 34.0% ] 33.61% | 854 | 16.3% |
[ 34.0% - 34.5% ] 34.29% | 1,782 | 24.8% |
[ 34.5% - 35.0% ] 34.66% | 7,332 | 22.4% |
[ 35.0% - 35.5% ] 35.26% | 1,781 | 36.2% |
[ 35.5% - 36.0% ] 35.66% | 802 | 25.9% |
[ 36.0% - 36.5% ] 36.31% | 2,702 | 29.3% |
[ 36.5% - 37.0% ] 36.70% | 4,741 | 22.7% |
[ 37.0% - 37.5% ] 37.48% | 3,685 | 20.2% |
[ 37.5% - 38.0% ] 37.87% | 375 | 14.8% |
[ 38.0% - 38.5% ] 38.30% | 5,742 | 14.2% |
[ 38.5% - 39.0% ] 38.66% | 2,703 | 20.3% |
[ 39.5% - 40.0% ] 39.67% | 1,346 | 25.4% |
[ 40.0% - 40.5% ] 40.32% | 888 | 29.2% |
[ 41.0% - 41.5% ] 41.15% | 1,718 | 24.0% |
[ 41.5% - 42.0% ] 41.79% | 1,352 | 28.5% |
[ 42.0% - 42.5% ] 42.23% | 959 | 22.6% |
[ 42.5% - 43.0% ] 42.71% | 1,407 | 11.1% |
[ 43.0% - 43.5% ] 43.32% | 1,295 | 20.6% |
[ 43.5% - 44.0% ] 43.66% | 284 | 22.4% |
[ 44.5% - 45.0% ] 44.59% | 222 | 67.0% |
[ 45.0% - 45.5% ] 45.15% | 1,165 | 32.6% |
[ 45.5% - 46.0% ] 45.54% | 303 | 71.2% |
[ 46.0% - 46.5% ] 46.39% | 97 | 14.6% |
[ 48.5% - 49.0% ] 48.84% | 86 | 29.0% |
[ 49.5% - 50.0% ] 49.90% | 497 | 9.6% |
[ 50.0% - 50.5% ] 50.39% | 1,153 | 24.4% |
[ 51.0% - 51.5% ] 51.42% | 1,474 | 23.3% |
[ 52.5% - 53.0% ] 52.51% | 219 | 7.0% |
[ 53.5% - 54.0% ] 53.85% | 65 | 14.0% |
[ 55.0% - 55.5% ] 55.05% | 218 | 7.6% |
[ 55.5% - 56.0% ] 55.80% | 1,353 | 11.0% |
[ 60.5% - 61.0% ] 60.77% | 130 | 25.7% |
[ 63.5% - 64.0% ] 63.89% | 180 | 12.8% |
[ 64.0% - 64.5% ] 64.21% | 95 | 23.5% |
[ 68.0% - 68.5% ] 68.06% | 72 | 54.5% |
[ 73.0% - 73.5% ] 73.33% | 225 | 6.1% |
[ 73.5% - 74.0% ] 73.72% | 137 | 2.5% |
[ 82.5% - 83.0% ] 82.74% | 168 | 34.9% |
[ 99.5% - 100.0% ] 100.00% | 27 | 100.0% |