French GED/Equivalency
COMPARE
French
Select to Compare
GED/Equivalency
French GED/Equivalency
87.1%
GED/EQUIVALENCY
95.2/ 100
METRIC RATING
111th/ 347
METRIC RANK
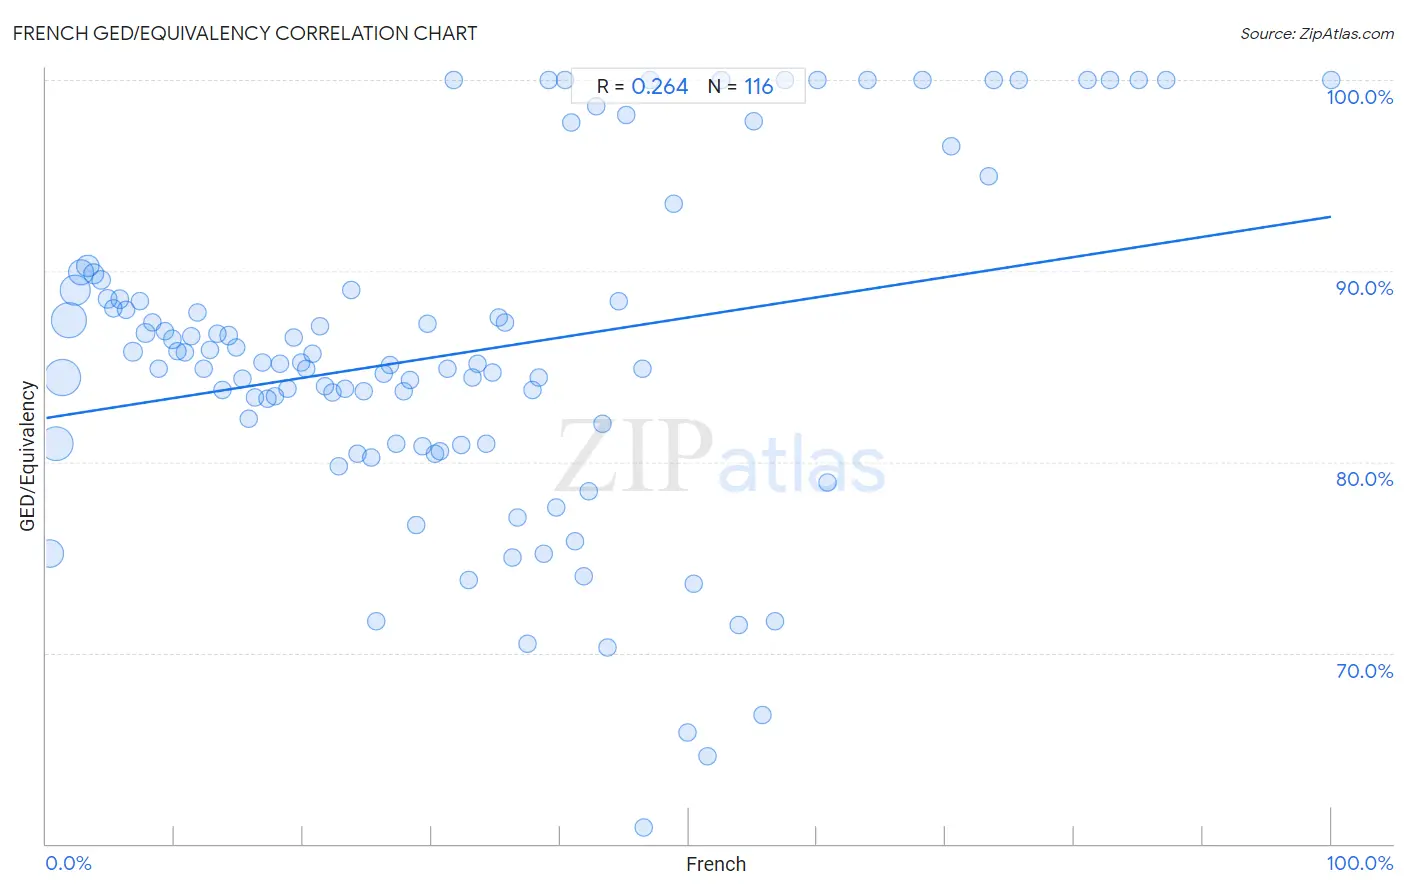
French GED/Equivalency Correlation Chart
The statistical analysis conducted on geographies consisting of 572,427,361 people shows a weak positive correlation between the proportion of French and percentage of population with at least ged/equivalency education in the United States with a correlation coefficient (R) of 0.264 and weighted average of 87.1%. On average, for every 1% (one percent) increase in French within a typical geography, there is an increase of 0.11% in percentage of population with at least ged/equivalency education.
It is essential to understand that the correlation between the percentage of French and percentage of population with at least ged/equivalency education does not imply a direct cause-and-effect relationship. It remains uncertain whether the presence of French influences an upward or downward trend in the level of percentage of population with at least ged/equivalency education within an area, or if French simply ended up residing in those areas with higher or lower levels of percentage of population with at least ged/equivalency education due to other factors.
Demographics Similar to French by GED/Equivalency
In terms of ged/equivalency, the demographic groups most similar to French are Egyptian (87.1%, a difference of 0.0%), Immigrants from Eastern Europe (87.1%, a difference of 0.030%), Canadian (87.1%, a difference of 0.040%), Tlingit-Haida (87.0%, a difference of 0.050%), and Assyrian/Chaldean/Syriac (87.0%, a difference of 0.050%).
| Demographics | Rating | Rank | GED/Equivalency |
| Immigrants from Hungary | 96.0 /100 | #104 | Exceptional 87.2% |
| Indians (Asian) | 95.9 /100 | #105 | Exceptional 87.1% |
| Immigrants from Zimbabwe | 95.8 /100 | #106 | Exceptional 87.1% |
| Icelanders | 95.7 /100 | #107 | Exceptional 87.1% |
| Canadians | 95.6 /100 | #108 | Exceptional 87.1% |
| Immigrants from Eastern Europe | 95.5 /100 | #109 | Exceptional 87.1% |
| Egyptians | 95.3 /100 | #110 | Exceptional 87.1% |
| French | 95.2 /100 | #111 | Exceptional 87.1% |
| Tlingit-Haida | 94.8 /100 | #112 | Exceptional 87.0% |
| Assyrians/Chaldeans/Syriacs | 94.8 /100 | #113 | Exceptional 87.0% |
| Immigrants from Kazakhstan | 94.7 /100 | #114 | Exceptional 87.0% |
| Mongolians | 94.6 /100 | #115 | Exceptional 87.0% |
| Swiss | 94.5 /100 | #116 | Exceptional 87.0% |
| Immigrants from Hong Kong | 93.8 /100 | #117 | Exceptional 86.9% |
| French Canadians | 93.2 /100 | #118 | Exceptional 86.9% |
French GED/Equivalency Correlation Summary
| Measurement | French Data | GED/Equivalency Data |
| Minimum | 0.26% | 60.9% |
| Maximum | 100.0% | 100.0% |
| Range | 99.7% | 39.1% |
| Mean | 31.7% | 85.6% |
| Median | 29.0% | 85.2% |
| Interquartile 25% (IQ1) | 14.5% | 81.0% |
| Interquartile 75% (IQ3) | 43.5% | 88.8% |
| Interquartile Range (IQR) | 29.0% | 7.8% |
| Standard Deviation (Sample) | 21.8% | 8.7% |
| Standard Deviation (Population) | 21.7% | 8.7% |
Correlation Details
| French Percentile | Sample Size | GED/Equivalency |
[ 0.0% - 0.5% ] 0.26% | 61,572,544 | 75.2% |
[ 0.5% - 1.0% ] 0.77% | 97,124,178 | 80.9% |
[ 1.0% - 1.5% ] 1.25% | 111,030,553 | 84.4% |
[ 1.5% - 2.0% ] 1.74% | 101,475,069 | 87.4% |
[ 2.0% - 2.5% ] 2.24% | 71,568,858 | 89.0% |
[ 2.5% - 3.0% ] 2.72% | 46,793,773 | 89.9% |
[ 3.0% - 3.5% ] 3.22% | 26,124,604 | 90.3% |
[ 3.5% - 4.0% ] 3.72% | 14,668,130 | 89.9% |
[ 4.0% - 4.5% ] 4.24% | 8,802,088 | 89.5% |
[ 4.5% - 5.0% ] 4.75% | 5,734,346 | 88.5% |
[ 5.0% - 5.5% ] 5.23% | 4,686,516 | 88.0% |
[ 5.5% - 6.0% ] 5.74% | 2,809,551 | 88.5% |
[ 6.0% - 6.5% ] 6.23% | 1,746,560 | 88.0% |
[ 6.5% - 7.0% ] 6.75% | 1,727,281 | 85.8% |
[ 7.0% - 7.5% ] 7.26% | 1,315,791 | 88.4% |
[ 7.5% - 8.0% ] 7.72% | 1,273,616 | 86.7% |
[ 8.0% - 8.5% ] 8.23% | 1,261,419 | 87.3% |
[ 8.5% - 9.0% ] 8.76% | 1,046,780 | 84.9% |
[ 9.0% - 9.5% ] 9.21% | 1,121,260 | 86.8% |
[ 9.5% - 10.0% ] 9.78% | 1,033,279 | 86.4% |
[ 10.0% - 10.5% ] 10.23% | 723,130 | 85.8% |
[ 10.5% - 11.0% ] 10.80% | 1,129,466 | 85.7% |
[ 11.0% - 11.5% ] 11.24% | 446,283 | 86.6% |
[ 11.5% - 12.0% ] 11.75% | 425,968 | 87.8% |
[ 12.0% - 12.5% ] 12.26% | 620,199 | 84.9% |
[ 12.5% - 13.0% ] 12.76% | 598,029 | 85.9% |
[ 13.0% - 13.5% ] 13.29% | 687,578 | 86.7% |
[ 13.5% - 14.0% ] 13.71% | 499,775 | 83.8% |
[ 14.0% - 14.5% ] 14.24% | 575,830 | 86.6% |
[ 14.5% - 15.0% ] 14.76% | 347,622 | 86.0% |
[ 15.0% - 15.5% ] 15.27% | 458,016 | 84.3% |
[ 15.5% - 16.0% ] 15.79% | 323,159 | 82.2% |
[ 16.0% - 16.5% ] 16.24% | 478,023 | 83.3% |
[ 16.5% - 17.0% ] 16.80% | 340,009 | 85.2% |
[ 17.0% - 17.5% ] 17.24% | 171,729 | 83.3% |
[ 17.5% - 18.0% ] 17.78% | 292,355 | 83.4% |
[ 18.0% - 18.5% ] 18.20% | 180,802 | 85.2% |
[ 18.5% - 19.0% ] 18.76% | 63,194 | 83.8% |
[ 19.0% - 19.5% ] 19.25% | 83,339 | 86.5% |
[ 19.5% - 20.0% ] 19.81% | 154,749 | 85.2% |
[ 20.0% - 20.5% ] 20.24% | 57,825 | 84.9% |
[ 20.5% - 21.0% ] 20.73% | 138,956 | 85.7% |
[ 21.0% - 21.5% ] 21.27% | 83,329 | 87.1% |
[ 21.5% - 22.0% ] 21.69% | 72,425 | 84.0% |
[ 22.0% - 22.5% ] 22.28% | 62,456 | 83.6% |
[ 22.5% - 23.0% ] 22.77% | 64,280 | 79.8% |
[ 23.0% - 23.5% ] 23.26% | 90,366 | 83.8% |
[ 23.5% - 24.0% ] 23.78% | 48,680 | 89.0% |
[ 24.0% - 24.5% ] 24.22% | 35,013 | 80.4% |
[ 24.5% - 25.0% ] 24.75% | 20,011 | 83.7% |
[ 25.0% - 25.5% ] 25.29% | 16,831 | 80.2% |
[ 25.5% - 26.0% ] 25.73% | 7,494 | 71.6% |
[ 26.0% - 26.5% ] 26.25% | 21,053 | 84.6% |
[ 26.5% - 27.0% ] 26.77% | 7,997 | 85.0% |
[ 27.0% - 27.5% ] 27.25% | 28,604 | 81.0% |
[ 27.5% - 28.0% ] 27.79% | 21,310 | 83.7% |
[ 28.0% - 28.5% ] 28.28% | 16,541 | 84.3% |
[ 28.5% - 29.0% ] 28.78% | 9,005 | 76.7% |
[ 29.0% - 29.5% ] 29.28% | 20,020 | 80.8% |
[ 29.5% - 30.0% ] 29.72% | 8,638 | 87.3% |
[ 30.0% - 30.5% ] 30.24% | 3,809 | 80.4% |
[ 30.5% - 31.0% ] 30.61% | 6,069 | 80.6% |
[ 31.0% - 31.5% ] 31.23% | 8,085 | 84.9% |
[ 31.5% - 32.0% ] 31.76% | 148 | 100.0% |
[ 32.0% - 32.5% ] 32.25% | 524 | 80.9% |
[ 32.5% - 33.0% ] 32.86% | 3,947 | 73.8% |
[ 33.0% - 33.5% ] 33.19% | 4,143 | 84.4% |
[ 33.5% - 34.0% ] 33.60% | 997 | 85.1% |
[ 34.0% - 34.5% ] 34.29% | 1,782 | 81.0% |
[ 34.5% - 35.0% ] 34.69% | 8,359 | 84.7% |
[ 35.0% - 35.5% ] 35.24% | 1,938 | 87.6% |
[ 35.5% - 36.0% ] 35.73% | 1,198 | 87.3% |
[ 36.0% - 36.5% ] 36.31% | 2,713 | 75.0% |
[ 36.5% - 37.0% ] 36.70% | 4,741 | 77.1% |
[ 37.0% - 37.5% ] 37.48% | 3,709 | 70.5% |
[ 37.5% - 38.0% ] 37.87% | 375 | 83.8% |
[ 38.0% - 38.5% ] 38.30% | 5,841 | 84.4% |
[ 38.5% - 39.0% ] 38.69% | 3,107 | 75.2% |
[ 39.0% - 39.5% ] 39.13% | 23 | 100.0% |
[ 39.5% - 40.0% ] 39.67% | 1,346 | 77.6% |
[ 40.0% - 40.5% ] 40.34% | 1,056 | 100.0% |
[ 40.5% - 41.0% ] 40.90% | 401 | 97.8% |
[ 41.0% - 41.5% ] 41.16% | 1,805 | 75.9% |
[ 41.5% - 42.0% ] 41.79% | 1,352 | 74.0% |
[ 42.0% - 42.5% ] 42.23% | 959 | 78.5% |
[ 42.5% - 43.0% ] 42.75% | 1,663 | 98.6% |
[ 43.0% - 43.5% ] 43.32% | 1,332 | 82.0% |
[ 43.5% - 44.0% ] 43.66% | 284 | 70.3% |
[ 44.5% - 45.0% ] 44.59% | 222 | 88.4% |
[ 45.0% - 45.5% ] 45.15% | 1,165 | 98.2% |
[ 46.0% - 46.5% ] 46.39% | 97 | 84.8% |
[ 46.5% - 47.0% ] 46.51% | 43 | 60.9% |
[ 47.0% - 47.5% ] 47.01% | 134 | 100.0% |
[ 48.5% - 49.0% ] 48.84% | 86 | 93.5% |
[ 49.5% - 50.0% ] 49.90% | 511 | 65.8% |
[ 50.0% - 50.5% ] 50.39% | 1,153 | 73.6% |
[ 51.0% - 51.5% ] 51.42% | 1,474 | 64.6% |
[ 52.5% - 53.0% ] 52.51% | 219 | 100.0% |
[ 53.5% - 54.0% ] 53.85% | 65 | 71.4% |
[ 55.0% - 55.5% ] 55.05% | 218 | 97.8% |
[ 55.5% - 56.0% ] 55.77% | 1,854 | 66.7% |
[ 56.5% - 57.0% ] 56.72% | 67 | 71.6% |
[ 57.0% - 57.5% ] 57.50% | 40 | 100.0% |
[ 60.0% - 60.5% ] 60.00% | 25 | 100.0% |
[ 60.5% - 61.0% ] 60.77% | 130 | 78.9% |
[ 63.5% - 64.0% ] 63.89% | 180 | 100.0% |
[ 68.0% - 68.5% ] 68.22% | 258 | 100.0% |
[ 70.0% - 70.5% ] 70.45% | 335 | 96.6% |
[ 73.0% - 73.5% ] 73.33% | 225 | 95.0% |
[ 73.5% - 74.0% ] 73.72% | 137 | 100.0% |
[ 75.5% - 76.0% ] 75.71% | 70 | 100.0% |
[ 81.0% - 81.5% ] 81.03% | 116 | 100.0% |
[ 82.5% - 83.0% ] 82.74% | 168 | 100.0% |
[ 85.0% - 85.5% ] 85.00% | 40 | 100.0% |
[ 87.0% - 87.5% ] 87.18% | 78 | 100.0% |
[ 99.5% - 100.0% ] 100.00% | 260 | 100.0% |