French Receiving Food Stamps
COMPARE
French
Select to Compare
Receiving Food Stamps
French Receiving Food Stamps
10.7%
PUBLIC INCOME | FOOD STAMPS
92.3/ 100
METRIC RATING
131st/ 347
METRIC RANK
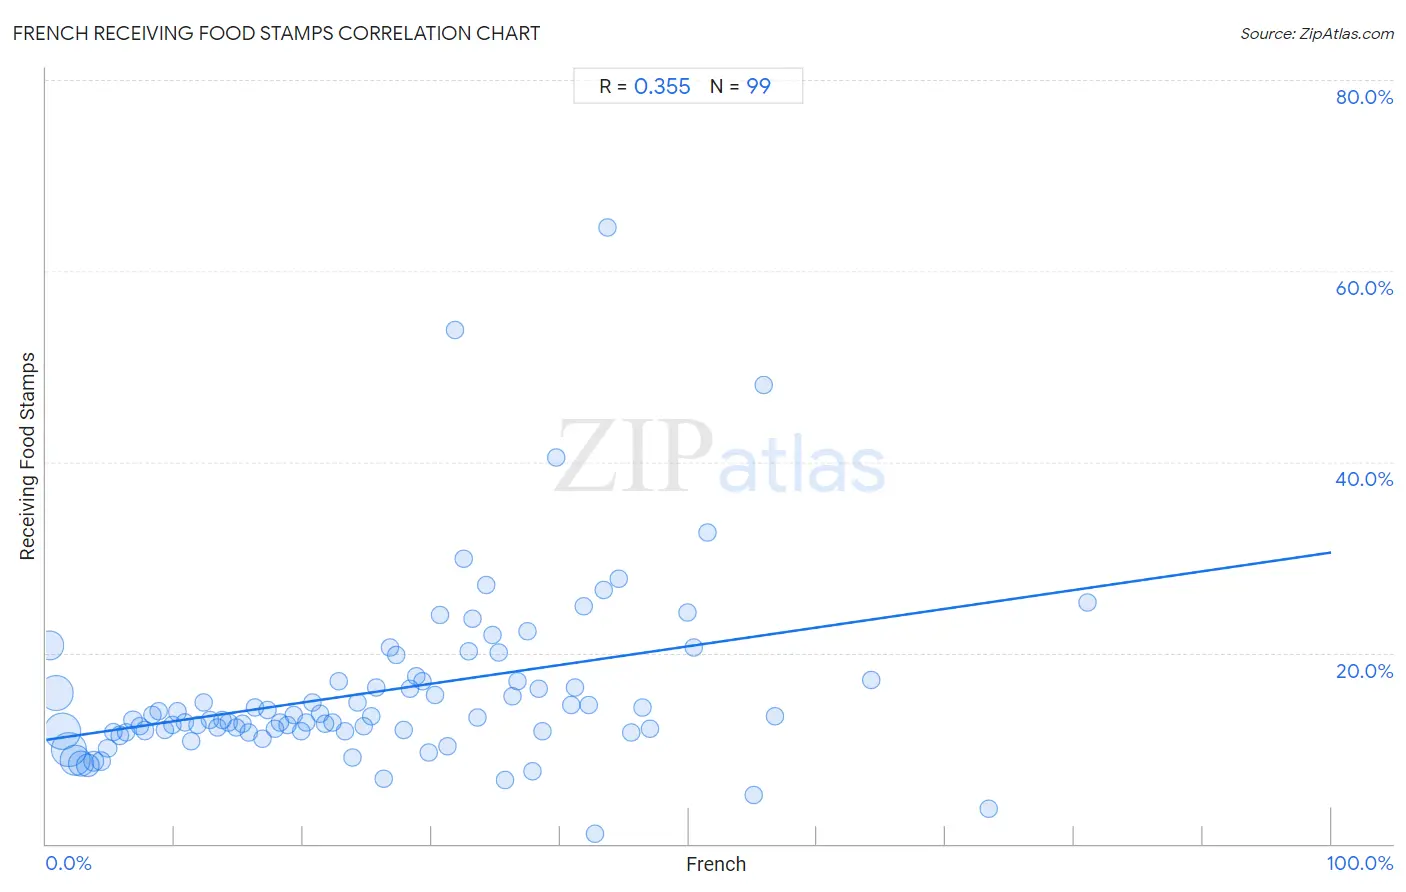
French Receiving Food Stamps Correlation Chart
The statistical analysis conducted on geographies consisting of 568,765,352 people shows a mild positive correlation between the proportion of French and percentage of population receiving government assistance and/or food stamps in the United States with a correlation coefficient (R) of 0.355 and weighted average of 10.7%. On average, for every 1% (one percent) increase in French within a typical geography, there is an increase of 0.20% in percentage of population receiving government assistance and/or food stamps.
It is essential to understand that the correlation between the percentage of French and percentage of population receiving government assistance and/or food stamps does not imply a direct cause-and-effect relationship. It remains uncertain whether the presence of French influences an upward or downward trend in the level of percentage of population receiving government assistance and/or food stamps within an area, or if French simply ended up residing in those areas with higher or lower levels of percentage of population receiving government assistance and/or food stamps due to other factors.
Demographics Similar to French by Receiving Food Stamps
In terms of receiving food stamps, the demographic groups most similar to French are Israeli (10.7%, a difference of 0.0%), Immigrants from Jordan (10.7%, a difference of 0.10%), Yugoslavian (10.7%, a difference of 0.10%), Immigrants from Ethiopia (10.7%, a difference of 0.11%), and Afghan (10.7%, a difference of 0.14%).
| Demographics | Rating | Rank | Receiving Food Stamps |
| Paraguayans | 93.0 /100 | #124 | Exceptional 10.7% |
| Ukrainians | 92.8 /100 | #125 | Exceptional 10.7% |
| Afghans | 92.6 /100 | #126 | Exceptional 10.7% |
| Immigrants from Ethiopia | 92.6 /100 | #127 | Exceptional 10.7% |
| Immigrants from Jordan | 92.5 /100 | #128 | Exceptional 10.7% |
| Yugoslavians | 92.5 /100 | #129 | Exceptional 10.7% |
| Israelis | 92.4 /100 | #130 | Exceptional 10.7% |
| French | 92.3 /100 | #131 | Exceptional 10.7% |
| Immigrants from Germany | 92.0 /100 | #132 | Exceptional 10.7% |
| Immigrants from Russia | 90.9 /100 | #133 | Exceptional 10.8% |
| Immigrants from Brazil | 90.3 /100 | #134 | Exceptional 10.8% |
| Argentineans | 90.2 /100 | #135 | Exceptional 10.8% |
| Slovaks | 89.8 /100 | #136 | Excellent 10.8% |
| Immigrants from Eastern Europe | 89.8 /100 | #137 | Excellent 10.8% |
| Immigrants from Moldova | 88.5 /100 | #138 | Excellent 10.9% |
French Receiving Food Stamps Correlation Summary
| Measurement | French Data | Receiving Food Stamps Data |
| Minimum | 0.26% | 1.1% |
| Maximum | 81.0% | 64.6% |
| Range | 80.8% | 63.5% |
| Mean | 26.0% | 16.0% |
| Median | 24.7% | 13.3% |
| Interquartile 25% (IQ1) | 12.3% | 11.8% |
| Interquartile 75% (IQ3) | 37.5% | 17.1% |
| Interquartile Range (IQR) | 25.2% | 5.3% |
| Standard Deviation (Sample) | 16.9% | 9.4% |
| Standard Deviation (Population) | 16.8% | 9.3% |
Correlation Details
| French Percentile | Sample Size | Receiving Food Stamps |
[ 0.0% - 0.5% ] 0.26% | 61,233,750 | 20.8% |
[ 0.5% - 1.0% ] 0.77% | 96,609,703 | 15.8% |
[ 1.0% - 1.5% ] 1.25% | 110,544,809 | 11.8% |
[ 1.5% - 2.0% ] 1.74% | 101,023,879 | 9.9% |
[ 2.0% - 2.5% ] 2.24% | 71,174,587 | 8.7% |
[ 2.5% - 3.0% ] 2.72% | 46,436,953 | 8.4% |
[ 3.0% - 3.5% ] 3.22% | 25,880,749 | 8.2% |
[ 3.5% - 4.0% ] 3.72% | 14,494,525 | 8.6% |
[ 4.0% - 4.5% ] 4.24% | 8,690,218 | 8.7% |
[ 4.5% - 5.0% ] 4.75% | 5,588,220 | 10.0% |
[ 5.0% - 5.5% ] 5.23% | 4,612,006 | 11.7% |
[ 5.5% - 6.0% ] 5.74% | 2,768,495 | 11.4% |
[ 6.0% - 6.5% ] 6.23% | 1,711,851 | 11.7% |
[ 6.5% - 7.0% ] 6.75% | 1,692,687 | 13.0% |
[ 7.0% - 7.5% ] 7.25% | 1,278,715 | 12.3% |
[ 7.5% - 8.0% ] 7.72% | 1,254,977 | 11.9% |
[ 8.0% - 8.5% ] 8.23% | 1,244,763 | 13.5% |
[ 8.5% - 9.0% ] 8.76% | 1,033,629 | 13.9% |
[ 9.0% - 9.5% ] 9.21% | 1,090,070 | 11.9% |
[ 9.5% - 10.0% ] 9.78% | 1,022,319 | 12.4% |
[ 10.0% - 10.5% ] 10.23% | 717,018 | 13.8% |
[ 10.5% - 11.0% ] 10.80% | 1,113,165 | 12.7% |
[ 11.0% - 11.5% ] 11.24% | 439,305 | 10.7% |
[ 11.5% - 12.0% ] 11.75% | 413,107 | 12.4% |
[ 12.0% - 12.5% ] 12.26% | 614,476 | 14.8% |
[ 12.5% - 13.0% ] 12.77% | 592,249 | 12.9% |
[ 13.0% - 13.5% ] 13.29% | 682,108 | 12.2% |
[ 13.5% - 14.0% ] 13.71% | 494,557 | 13.0% |
[ 14.0% - 14.5% ] 14.24% | 567,926 | 12.7% |
[ 14.5% - 15.0% ] 14.76% | 343,834 | 12.2% |
[ 15.0% - 15.5% ] 15.27% | 454,008 | 12.5% |
[ 15.5% - 16.0% ] 15.79% | 319,417 | 11.7% |
[ 16.0% - 16.5% ] 16.24% | 476,154 | 14.3% |
[ 16.5% - 17.0% ] 16.80% | 337,672 | 11.0% |
[ 17.0% - 17.5% ] 17.24% | 169,713 | 13.9% |
[ 17.5% - 18.0% ] 17.78% | 291,596 | 12.1% |
[ 18.0% - 18.5% ] 18.20% | 178,770 | 12.7% |
[ 18.5% - 19.0% ] 18.76% | 61,704 | 12.4% |
[ 19.0% - 19.5% ] 19.25% | 80,820 | 13.5% |
[ 19.5% - 20.0% ] 19.81% | 150,388 | 11.8% |
[ 20.0% - 20.5% ] 20.25% | 55,205 | 12.7% |
[ 20.5% - 21.0% ] 20.73% | 137,135 | 14.7% |
[ 21.0% - 21.5% ] 21.27% | 80,550 | 13.6% |
[ 21.5% - 22.0% ] 21.69% | 71,757 | 12.5% |
[ 22.0% - 22.5% ] 22.28% | 61,383 | 12.7% |
[ 22.5% - 23.0% ] 22.77% | 63,739 | 17.0% |
[ 23.0% - 23.5% ] 23.26% | 88,901 | 11.7% |
[ 23.5% - 24.0% ] 23.78% | 47,569 | 9.0% |
[ 24.0% - 24.5% ] 24.22% | 31,986 | 14.8% |
[ 24.5% - 25.0% ] 24.74% | 19,493 | 12.3% |
[ 25.0% - 25.5% ] 25.29% | 16,831 | 13.4% |
[ 25.5% - 26.0% ] 25.72% | 7,262 | 16.3% |
[ 26.0% - 26.5% ] 26.26% | 20,396 | 6.8% |
[ 26.5% - 27.0% ] 26.80% | 6,751 | 20.5% |
[ 27.0% - 27.5% ] 27.25% | 27,553 | 19.8% |
[ 27.5% - 28.0% ] 27.80% | 20,957 | 11.9% |
[ 28.0% - 28.5% ] 28.28% | 16,002 | 16.3% |
[ 28.5% - 29.0% ] 28.80% | 8,348 | 17.5% |
[ 29.0% - 29.5% ] 29.28% | 20,003 | 17.1% |
[ 29.5% - 30.0% ] 29.72% | 8,547 | 9.6% |
[ 30.0% - 30.5% ] 30.24% | 3,330 | 15.5% |
[ 30.5% - 31.0% ] 30.61% | 6,027 | 23.9% |
[ 31.0% - 31.5% ] 31.23% | 7,809 | 10.2% |
[ 31.5% - 32.0% ] 31.82% | 44 | 53.8% |
[ 32.0% - 32.5% ] 32.45% | 265 | 29.8% |
[ 32.5% - 33.0% ] 32.87% | 3,858 | 20.2% |
[ 33.0% - 33.5% ] 33.16% | 3,417 | 23.5% |
[ 33.5% - 34.0% ] 33.60% | 997 | 13.3% |
[ 34.0% - 34.5% ] 34.20% | 927 | 27.1% |
[ 34.5% - 35.0% ] 34.69% | 8,236 | 21.8% |
[ 35.0% - 35.5% ] 35.26% | 1,781 | 20.0% |
[ 35.5% - 36.0% ] 35.66% | 802 | 6.7% |
[ 36.0% - 36.5% ] 36.31% | 2,702 | 15.4% |
[ 36.5% - 37.0% ] 36.70% | 4,741 | 17.0% |
[ 37.0% - 37.5% ] 37.48% | 3,685 | 22.3% |
[ 37.5% - 38.0% ] 37.87% | 375 | 7.6% |
[ 38.0% - 38.5% ] 38.29% | 5,370 | 16.2% |
[ 38.5% - 39.0% ] 38.66% | 2,703 | 11.8% |
[ 39.5% - 40.0% ] 39.67% | 1,346 | 40.4% |
[ 40.5% - 41.0% ] 40.85% | 71 | 14.5% |
[ 41.0% - 41.5% ] 41.14% | 1,293 | 16.4% |
[ 41.5% - 42.0% ] 41.81% | 1,136 | 24.9% |
[ 42.0% - 42.5% ] 42.23% | 959 | 14.6% |
[ 42.5% - 43.0% ] 42.72% | 1,271 | 1.1% |
[ 43.0% - 43.5% ] 43.41% | 949 | 26.6% |
[ 43.5% - 44.0% ] 43.71% | 151 | 64.6% |
[ 44.5% - 45.0% ] 44.59% | 222 | 27.8% |
[ 45.5% - 46.0% ] 45.54% | 303 | 11.6% |
[ 46.0% - 46.5% ] 46.39% | 97 | 14.3% |
[ 47.0% - 47.5% ] 47.01% | 134 | 12.1% |
[ 49.5% - 50.0% ] 49.90% | 497 | 24.2% |
[ 50.0% - 50.5% ] 50.38% | 1,046 | 20.6% |
[ 51.0% - 51.5% ] 51.42% | 1,474 | 32.6% |
[ 55.0% - 55.5% ] 55.05% | 218 | 5.1% |
[ 55.5% - 56.0% ] 55.80% | 1,353 | 48.0% |
[ 56.5% - 57.0% ] 56.72% | 67 | 13.4% |
[ 64.0% - 64.5% ] 64.21% | 95 | 17.2% |
[ 73.0% - 73.5% ] 73.33% | 225 | 3.7% |
[ 81.0% - 81.5% ] 81.03% | 116 | 25.3% |