Estonian Married-couple Households
COMPARE
Estonian
Select to Compare
Married-couple Households
Estonian Married-couple Households
47.7%
MARRIED-COUPLE HOUSEHOLDS
94.7/ 100
METRIC RATING
107th/ 347
METRIC RANK
Estonian Married-couple Households Correlation Chart
The statistical analysis conducted on geographies consisting of 123,500,387 people shows a slight negative correlation between the proportion of Estonians and percentage of married-couple family households in the United States with a correlation coefficient (R) of -0.067 and weighted average of 47.7%. On average, for every 1% (one percent) increase in Estonians within a typical geography, there is a decrease of 0.39% in percentage of married-couple family households.
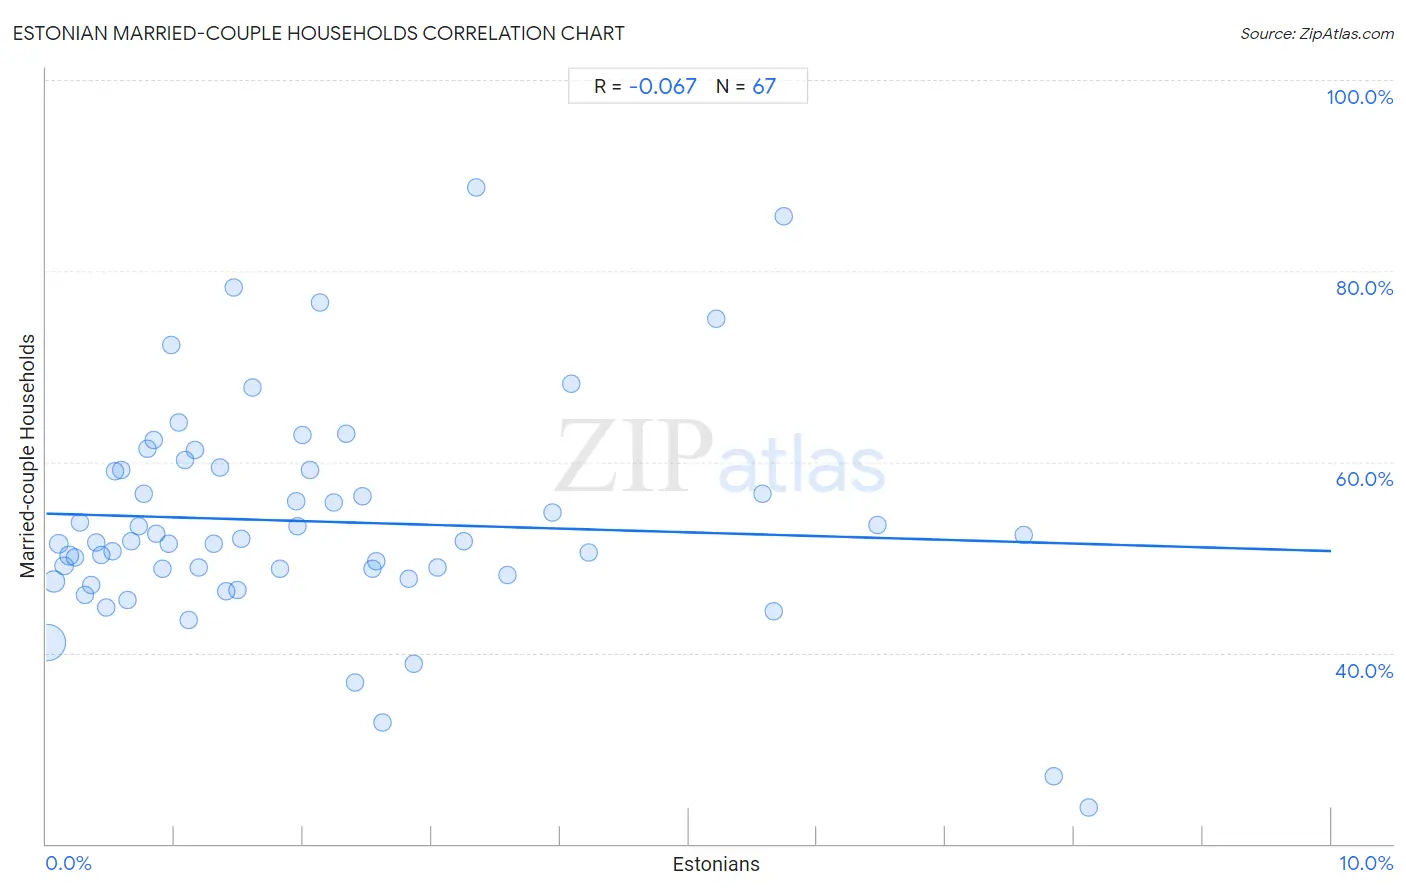
It is essential to understand that the correlation between the percentage of Estonians and percentage of married-couple family households does not imply a direct cause-and-effect relationship. It remains uncertain whether the presence of Estonians influences an upward or downward trend in the level of percentage of married-couple family households within an area, or if Estonians simply ended up residing in those areas with higher or lower levels of percentage of married-couple family households due to other factors.
Demographics Similar to Estonians by Married-couple Households
In terms of married-couple households, the demographic groups most similar to Estonians are Immigrants from Japan (47.7%, a difference of 0.050%), Immigrants from Jordan (47.7%, a difference of 0.10%), Macedonian (47.6%, a difference of 0.12%), Syrian (47.6%, a difference of 0.13%), and Peruvian (47.6%, a difference of 0.14%).
| Demographics | Rating | Rank | Married-couple Households |
| Immigrants from Italy | 96.3 /100 | #100 | Exceptional 47.9% |
| Turks | 96.1 /100 | #101 | Exceptional 47.8% |
| Slavs | 96.0 /100 | #102 | Exceptional 47.8% |
| Hawaiians | 96.0 /100 | #103 | Exceptional 47.8% |
| Immigrants from South Africa | 96.0 /100 | #104 | Exceptional 47.8% |
| Immigrants from Czechoslovakia | 95.5 /100 | #105 | Exceptional 47.8% |
| Portuguese | 95.5 /100 | #106 | Exceptional 47.8% |
| Estonians | 94.7 /100 | #107 | Exceptional 47.7% |
| Immigrants from Japan | 94.4 /100 | #108 | Exceptional 47.7% |
| Immigrants from Jordan | 94.1 /100 | #109 | Exceptional 47.7% |
| Macedonians | 93.9 /100 | #110 | Exceptional 47.6% |
| Syrians | 93.9 /100 | #111 | Exceptional 47.6% |
| Peruvians | 93.8 /100 | #112 | Exceptional 47.6% |
| Venezuelans | 93.8 /100 | #113 | Exceptional 47.6% |
| Immigrants from Europe | 93.7 /100 | #114 | Exceptional 47.6% |
Estonian Married-couple Households Correlation Summary
| Measurement | Estonian Data | Married-couple Households Data |
| Minimum | 0.014% | 23.8% |
| Maximum | 8.1% | 88.8% |
| Range | 8.1% | 65.0% |
| Mean | 2.1% | 53.8% |
| Median | 1.5% | 51.7% |
| Interquartile 25% (IQ1) | 0.66% | 48.1% |
| Interquartile 75% (IQ3) | 2.8% | 59.1% |
| Interquartile Range (IQR) | 2.2% | 11.0% |
| Standard Deviation (Sample) | 2.0% | 11.6% |
| Standard Deviation (Population) | 2.0% | 11.5% |
Correlation Details
| Estonian Percentile | Sample Size | Married-couple Households |
[ 0.0% - 0.5% ] 0.014% | 93,128,970 | 41.0% |
[ 0.0% - 0.5% ] 0.057% | 16,406,096 | 47.5% |
[ 0.0% - 0.5% ] 0.099% | 5,986,610 | 51.4% |
[ 0.0% - 0.5% ] 0.14% | 3,138,449 | 49.1% |
[ 0.0% - 0.5% ] 0.18% | 1,327,187 | 50.2% |
[ 0.0% - 0.5% ] 0.22% | 1,026,788 | 50.0% |
[ 0.0% - 0.5% ] 0.26% | 594,166 | 53.6% |
[ 0.0% - 0.5% ] 0.30% | 432,457 | 46.1% |
[ 0.0% - 0.5% ] 0.35% | 151,838 | 47.1% |
[ 0.0% - 0.5% ] 0.39% | 284,971 | 51.5% |
[ 0.0% - 0.5% ] 0.43% | 154,819 | 50.3% |
[ 0.0% - 0.5% ] 0.46% | 167,368 | 44.7% |
[ 0.5% - 1.0% ] 0.51% | 93,892 | 50.6% |
[ 0.5% - 1.0% ] 0.54% | 103,205 | 59.0% |
[ 0.5% - 1.0% ] 0.59% | 53,292 | 59.1% |
[ 0.5% - 1.0% ] 0.63% | 60,767 | 45.5% |
[ 0.5% - 1.0% ] 0.66% | 56,901 | 51.7% |
[ 0.5% - 1.0% ] 0.72% | 16,922 | 53.3% |
[ 0.5% - 1.0% ] 0.76% | 23,575 | 56.6% |
[ 0.5% - 1.0% ] 0.79% | 22,279 | 61.4% |
[ 0.5% - 1.0% ] 0.83% | 5,406 | 62.3% |
[ 0.5% - 1.0% ] 0.86% | 76,168 | 52.5% |
[ 0.5% - 1.0% ] 0.90% | 16,440 | 48.8% |
[ 0.5% - 1.0% ] 0.95% | 16,636 | 51.4% |
[ 0.5% - 1.0% ] 0.98% | 4,913 | 72.2% |
[ 1.0% - 1.5% ] 1.03% | 1,364 | 64.1% |
[ 1.0% - 1.5% ] 1.08% | 837 | 60.2% |
[ 1.0% - 1.5% ] 1.11% | 22,519 | 43.5% |
[ 1.0% - 1.5% ] 1.16% | 8,012 | 61.2% |
[ 1.0% - 1.5% ] 1.18% | 5,067 | 48.9% |
[ 1.0% - 1.5% ] 1.30% | 2,842 | 51.4% |
[ 1.0% - 1.5% ] 1.35% | 10,131 | 59.4% |
[ 1.0% - 1.5% ] 1.40% | 5,730 | 46.5% |
[ 1.0% - 1.5% ] 1.46% | 1,304 | 78.3% |
[ 1.0% - 1.5% ] 1.49% | 4,371 | 46.6% |
[ 1.5% - 2.0% ] 1.51% | 3,500 | 51.9% |
[ 1.5% - 2.0% ] 1.61% | 13,080 | 67.9% |
[ 1.5% - 2.0% ] 1.82% | 8,851 | 48.8% |
[ 1.5% - 2.0% ] 1.94% | 1,493 | 55.9% |
[ 1.5% - 2.0% ] 1.95% | 7,417 | 53.2% |
[ 1.5% - 2.0% ] 1.99% | 8,430 | 62.8% |
[ 2.0% - 2.5% ] 2.05% | 15,599 | 59.1% |
[ 2.0% - 2.5% ] 2.13% | 564 | 76.7% |
[ 2.0% - 2.5% ] 2.24% | 1,294 | 55.8% |
[ 2.0% - 2.5% ] 2.33% | 472 | 62.9% |
[ 2.0% - 2.5% ] 2.40% | 874 | 36.8% |
[ 2.0% - 2.5% ] 2.46% | 1,300 | 56.4% |
[ 2.5% - 3.0% ] 2.54% | 3,822 | 48.8% |
[ 2.5% - 3.0% ] 2.56% | 3,043 | 49.5% |
[ 2.5% - 3.0% ] 2.62% | 1,145 | 32.7% |
[ 2.5% - 3.0% ] 2.82% | 3,441 | 47.7% |
[ 2.5% - 3.0% ] 2.86% | 1,362 | 38.9% |
[ 3.0% - 3.5% ] 3.04% | 1,544 | 49.0% |
[ 3.0% - 3.5% ] 3.25% | 154 | 51.7% |
[ 3.0% - 3.5% ] 3.35% | 418 | 88.8% |
[ 3.5% - 4.0% ] 3.59% | 2,286 | 48.1% |
[ 3.5% - 4.0% ] 3.94% | 1,067 | 54.7% |
[ 4.0% - 4.5% ] 4.08% | 1,567 | 68.1% |
[ 4.0% - 4.5% ] 4.23% | 213 | 50.4% |
[ 5.0% - 5.5% ] 5.21% | 595 | 75.0% |
[ 5.5% - 6.0% ] 5.57% | 754 | 56.7% |
[ 5.5% - 6.0% ] 5.66% | 1,838 | 44.3% |
[ 5.5% - 6.0% ] 5.74% | 244 | 85.7% |
[ 6.0% - 6.5% ] 6.47% | 1,113 | 53.4% |
[ 7.5% - 8.0% ] 7.60% | 171 | 52.3% |
[ 7.5% - 8.0% ] 7.84% | 370 | 27.1% |
[ 8.0% - 8.5% ] 8.11% | 74 | 23.8% |