Estonian vs Immigrants from Kuwait 4 or more Vehicles in Household

COMPARE

Estonian
Race
Ancestry
AfghanAfricanAlaska NativeAlaskan AthabascanAlbanianAleutAlsatianAmericanApacheArabArapahoArgentineanArmenianAssyrian/Chaldean/SyriacAustralianAustrianBahamianBangladeshiBarbadianBasqueBelgianBelizeanBermudanBhutaneseBlackfeetBolivianBrazilianBritishBritish West IndianBulgarianBurmeseCajunCambodianCanadianCape VerdeanCarpatho RusynCelticCentral AmericanCentral American IndianCherokeeCheyenneChickasawChileanChineseChippewaChoctawColombianColvilleComancheCosta RicanCreeCreekCroatianCrowCubanCypriotCzechCzechoslovakianDanishDelawareDominicanDutchDutch West IndianEastern EuropeanEcuadorianEgyptianEnglishEstonianEthiopianEuropeanFijianFilipinoFinnishFrenchFrench American IndianFrench CanadianGermanGerman RussianGhanaianGreekGuamanian/ChamorroGuatemalanGuyaneseHaitianHmongHonduranHopiHoumaHungarianIcelanderIndian (Asian)IndonesianInupiatIranianIraqiIrishIroquoisIsraeliItalianJamaicanJapaneseJordanianKenyanKiowaKoreanLaotianLatvianLebaneseLiberianLithuanianLumbeeLuxembourgerMacedonianMalaysianMalteseMarshalleseMenomineeMexicanMexican American IndianMongolianMoroccanNative HawaiianNavajoNepaleseNew ZealanderNicaraguanNigerianNorthern EuropeanNorwegianOkinawanOsageOttawaPaiutePakistaniPalestinianPanamanianParaguayanPennsylvania GermanPeruvianPimaPolishPortuguesePotawatomiPuebloPuerto RicanPuget Sound SalishRomanianRussianSalvadoranSamoanScandinavianScotch-IrishScottishSeminoleSenegaleseSerbianShoshoneSierra LeoneanSiouxSlavicSlovakSloveneSomaliSouth AfricanSouth AmericanSouth American IndianSoviet UnionSpaniardSpanishSpanish AmericanSpanish American IndianSri LankanSubsaharan AfricanSudaneseSwedishSwissSyrianTaiwaneseThaiTlingit-HaidaTohono O'OdhamTonganTrinidadian and TobagonianTsimshianTurkishU.S. Virgin IslanderUgandanUkrainianUruguayanUteVenezuelanVietnameseWelshWest IndianYakamaYaquiYugoslavianYumanYup'ikZimbabwean
Immigration
NonimmigrantsImmigrantsAfghanistanAfricaAlbaniaArgentinaArmeniaAsiaAustraliaAustriaBahamasBangladeshBarbadosBelarusBelgiumBelizeBoliviaBosnia and HerzegovinaBrazilBulgariaBurma/MyanmarCabo VerdeCambodiaCameroonCanadaCaribbeanCentral AmericaChileChinaColombiaCongoCosta RicaCroatiaCubaCzechoslovakiaDenmarkDominicaDominican RepublicEastern AfricaEastern AsiaEastern EuropeEcuadorEgyptEl SalvadorEnglandEritreaEthiopiaEuropeFijiFranceGermanyGhanaGreeceGrenadaGuatemalaGuyanaHaitiHondurasHong KongHungaryIndiaIndonesiaIranIraqIrelandIsraelItalyJamaicaJapanJordanKazakhstanKenyaKoreaLaosLatin AmericaLatviaLebanonLiberiaLithuaniaMalaysiaMexicoMicronesiaMiddle AfricaMoldovaMoroccoNepalNetherlandsNicaraguaNigeriaNorth AmericaNorth MacedoniaNorthern AfricaNorthern EuropeNorwayOceaniaPakistanPanamaPeruPhilippinesPolandPortugalRomaniaRussiaSaudi ArabiaScotlandSenegalSerbiaSierra LeoneSingaporeSomaliaSouth AfricaSouth AmericaSouth Central AsiaSouth Eastern AsiaSouthern EuropeSpainSri LankaSt. Vincent and the GrenadinesSudanSwedenSwitzerlandSyriaTaiwanThailandTrinidad and TobagoTurkeyUgandaUkraineUruguayUzbekistanVenezuelaVietnamWest IndiesWestern AfricaWestern AsiaWestern EuropeYemenZaireZimbabweAzores
Immigrants from Kuwait
Race
Ancestry
AfghanAfricanAlaska NativeAlaskan AthabascanAlbanianAleutAlsatianAmericanApacheArabArapahoArgentineanArmenianAssyrian/Chaldean/SyriacAustralianAustrianBahamianBangladeshiBarbadianBasqueBelgianBelizeanBermudanBhutaneseBlackfeetBolivianBrazilianBritishBritish West IndianBulgarianBurmeseCajunCambodianCanadianCape VerdeanCarpatho RusynCelticCentral AmericanCentral American IndianCherokeeCheyenneChickasawChileanChineseChippewaChoctawColombianColvilleComancheCosta RicanCreeCreekCroatianCrowCubanCypriotCzechCzechoslovakianDanishDelawareDominicanDutchDutch West IndianEastern EuropeanEcuadorianEgyptianEnglishEthiopianEuropeanFijianFilipinoFinnishFrenchFrench American IndianFrench CanadianGermanGerman RussianGhanaianGreekGuamanian/ChamorroGuatemalanGuyaneseHaitianHmongHonduranHopiHoumaHungarianIcelanderIndian (Asian)IndonesianInupiatIranianIraqiIrishIroquoisIsraeliItalianJamaicanJapaneseJordanianKenyanKiowaKoreanLaotianLatvianLebaneseLiberianLithuanianLumbeeLuxembourgerMacedonianMalaysianMalteseMarshalleseMenomineeMexicanMexican American IndianMongolianMoroccanNative HawaiianNavajoNepaleseNew ZealanderNicaraguanNigerianNorthern EuropeanNorwegianOkinawanOsageOttawaPaiutePakistaniPalestinianPanamanianParaguayanPennsylvania GermanPeruvianPimaPolishPortuguesePotawatomiPuebloPuerto RicanPuget Sound SalishRomanianRussianSalvadoranSamoanScandinavianScotch-IrishScottishSeminoleSenegaleseSerbianShoshoneSierra LeoneanSiouxSlavicSlovakSloveneSomaliSouth AfricanSouth AmericanSouth American IndianSoviet UnionSpaniardSpanishSpanish AmericanSpanish American IndianSri LankanSubsaharan AfricanSudaneseSwedishSwissSyrianTaiwaneseThaiTlingit-HaidaTohono O'OdhamTonganTrinidadian and TobagonianTsimshianTurkishU.S. Virgin IslanderUgandanUkrainianUruguayanUteVenezuelanVietnameseWelshWest IndianYakamaYaquiYugoslavianYumanYup'ikZimbabwean
Immigration
NonimmigrantsImmigrantsAfghanistanAfricaAlbaniaArgentinaArmeniaAsiaAustraliaAustriaBahamasBangladeshBarbadosBelarusBelgiumBelizeBoliviaBosnia and HerzegovinaBrazilBulgariaBurma/MyanmarCabo VerdeCambodiaCameroonCanadaCaribbeanCentral AmericaChileChinaColombiaCongoCosta RicaCroatiaCubaCzechoslovakiaDenmarkDominicaDominican RepublicEastern AfricaEastern AsiaEastern EuropeEcuadorEgyptEl SalvadorEnglandEritreaEthiopiaEuropeFijiFranceGermanyGhanaGreeceGrenadaGuatemalaGuyanaHaitiHondurasHong KongHungaryIndiaIndonesiaIranIraqIrelandIsraelItalyJamaicaJapanJordanKazakhstanKenyaKoreaKuwaitLaosLatin AmericaLatviaLebanonLiberiaLithuaniaMalaysiaMexicoMicronesiaMiddle AfricaMoldovaMoroccoNepalNetherlandsNicaraguaNigeriaNorth AmericaNorth MacedoniaNorthern AfricaNorthern EuropeNorwayOceaniaPakistanPanamaPeruPhilippinesPolandPortugalRomaniaRussiaSaudi ArabiaScotlandSenegalSerbiaSierra LeoneSingaporeSomaliaSouth AfricaSouth AmericaSouth Central AsiaSouth Eastern AsiaSouthern EuropeSpainSri LankaSt. Vincent and the GrenadinesSudanSwedenSwitzerlandSyriaTaiwanThailandTrinidad and TobagoTurkeyUgandaUkraineUruguayUzbekistanVenezuelaVietnamWest IndiesWestern AfricaWestern AsiaWestern EuropeYemenZaireZimbabweAzores
4 or more Vehicles in Household
Income
Poverty
Unemployment
Labor Participation
Family Structure
Vehicle Availability
Education Level
Disability

4 or more Vehicles in Household Comparison

Estonians

Immigrants from Kuwait

Average
Fair
6.4%
4 OR MORE VEHICLES IN HOUSEHOLD
55.1/ 100
METRIC RATING
169th/ 347
METRIC RANK
6.2%
4 OR MORE VEHICLES IN HOUSEHOLD
28.0/ 100
METRIC RATING
193rd/ 347
METRIC RANK

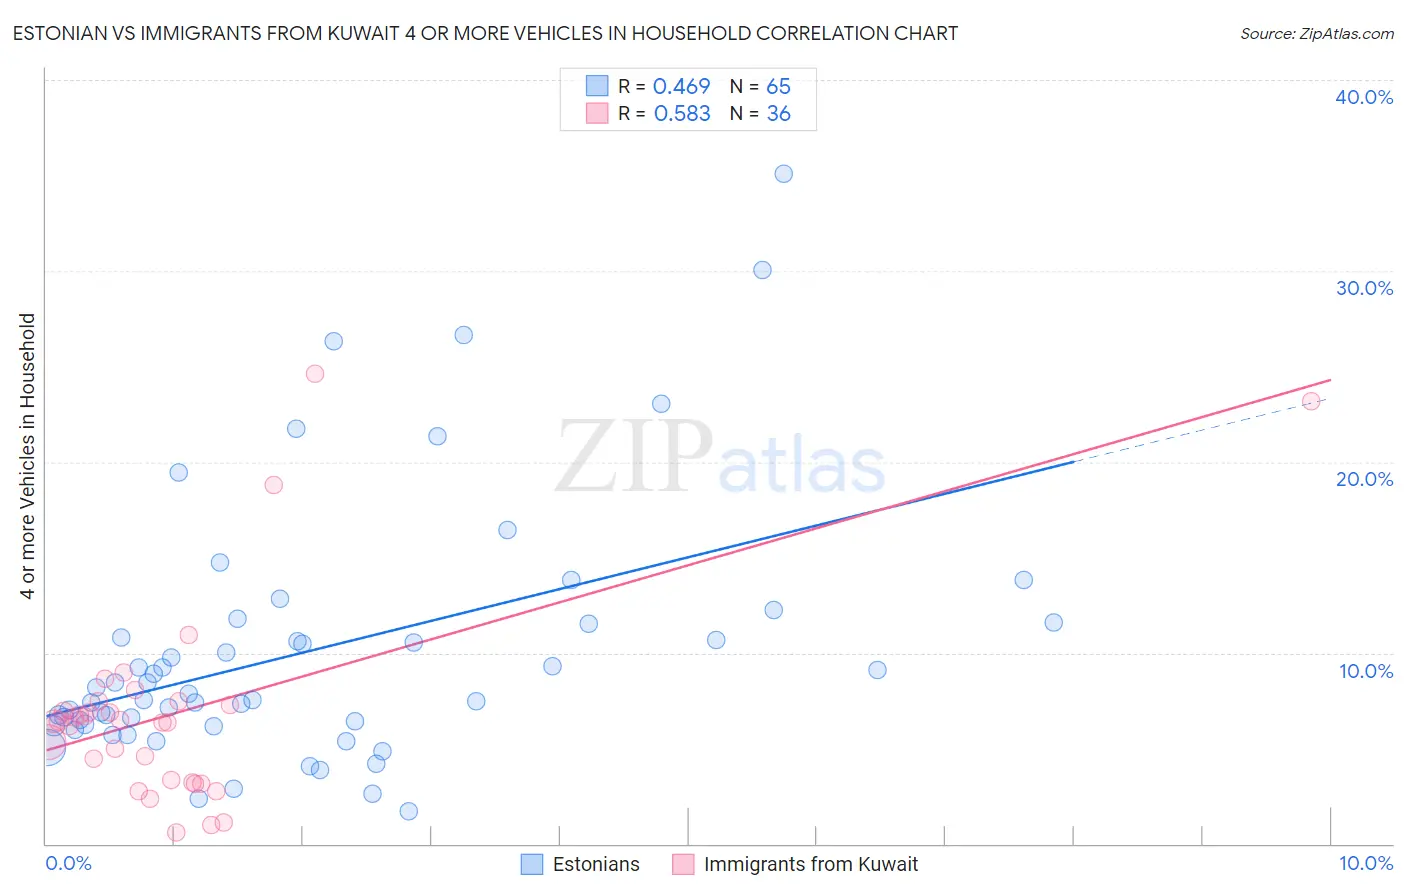
Estonian vs Immigrants from Kuwait 4 or more Vehicles in Household Correlation Chart

The statistical analysis conducted on geographies consisting of 123,188,089 people shows a moderate positive correlation between the proportion of Estonians and percentage of households with 4 or more vehicles available in the United States with a correlation coefficient (R) of 0.469 and weighted average of 6.4%. Similarly, the statistical analysis conducted on geographies consisting of 136,548,104 people shows a substantial positive correlation between the proportion of Immigrants from Kuwait and percentage of households with 4 or more vehicles available in the United States with a correlation coefficient (R) of 0.583 and weighted average of 6.2%, a difference of 3.0%.
Estonian vs Immigrants from Kuwait 4 or more Vehicles in Household

4 or more Vehicles in Household Correlation Summary

MeasurementEstonianImmigrants from Kuwait
Minimum1.7%0.56%
Maximum35.1%24.6%
Range33.4%24.1%
Mean10.1%6.9%
Median7.9%6.4%
Interquartile 25% (IQ1)6.2%3.3%
Interquartile 75% (IQ3)11.6%7.3%
Interquartile Range (IQR)5.3%4.1%
Standard Deviation (Sample)6.7%5.3%
Standard Deviation (Population)6.7%5.2%

Similar Demographics by 4 or more Vehicles in Household

Demographics Similar to Estonians by 4 or more Vehicles in Household

In terms of 4 or more vehicles in household, the demographic groups most similar to Estonians are Lebanese (6.4%, a difference of 0.070%), Polish (6.4%, a difference of 0.18%), Immigrants from Syria (6.3%, a difference of 0.24%), Immigrants from Denmark (6.4%, a difference of 0.28%), and Immigrants from India (6.3%, a difference of 0.32%).
DemographicsRating | Rank4 or more Vehicles in Household
Immigrants | Pakistan
63.2
/100
|
#162
Good
6.4%
Chileans
61.2
/100
|
#163
Good
6.4%
Hungarians
61.1
/100
|
#164
Good
6.4%
Immigrants | Peru
59.8
/100
|
#165
Average
6.4%
Immigrants | Denmark
57.8
/100
|
#166
Average
6.4%
Poles
56.9
/100
|
#167
Average
6.4%
Lebanese
55.8
/100
|
#168
Average
6.4%
Estonians
55.1
/100
|
#169
Average
6.4%
Immigrants | Syria
52.8
/100
|
#170
Average
6.3%
Immigrants | India
51.9
/100
|
#171
Average
6.3%
Immigrants | Lebanon
51.7
/100
|
#172
Average
6.3%
Slovenes
51.1
/100
|
#173
Average
6.3%
Lithuanians
50.0
/100
|
#174
Average
6.3%
Immigrants | Western Europe
48.8
/100
|
#175
Average
6.3%
Ukrainians
47.6
/100
|
#176
Average
6.3%

Demographics Similar to Immigrants from Kuwait by 4 or more Vehicles in Household

In terms of 4 or more vehicles in household, the demographic groups most similar to Immigrants from Kuwait are Immigrants from Sweden (6.2%, a difference of 0.13%), Argentinean (6.2%, a difference of 0.13%), Tsimshian (6.2%, a difference of 0.20%), Romanian (6.2%, a difference of 0.34%), and Inupiat (6.2%, a difference of 0.35%).
DemographicsRating | Rank4 or more Vehicles in Household
Immigrants | Northern Europe
36.8
/100
|
#186
Fair
6.2%
Immigrants | South Africa
35.4
/100
|
#187
Fair
6.2%
Kiowa
34.7
/100
|
#188
Fair
6.2%
Immigrants | Eastern Asia
33.3
/100
|
#189
Fair
6.2%
South Africans
32.2
/100
|
#190
Fair
6.2%
Inupiat
30.7
/100
|
#191
Fair
6.2%
Romanians
30.7
/100
|
#192
Fair
6.2%
Immigrants | Kuwait
28.0
/100
|
#193
Fair
6.2%
Immigrants | Sweden
27.0
/100
|
#194
Fair
6.2%
Argentineans
27.0
/100
|
#195
Fair
6.2%
Tsimshian
26.4
/100
|
#196
Fair
6.2%
Immigrants | Sri Lanka
23.7
/100
|
#197
Fair
6.1%
Immigrants | Portugal
22.3
/100
|
#198
Fair
6.1%
Immigrants | Norway
21.8
/100
|
#199
Fair
6.1%
Latvians
21.7
/100
|
#200
Fair
6.1%