Estonian Unemployment Among Women with Children Ages 6 to 17 years
COMPARE
Estonian
Select to Compare
Unemployment Among Women with Children Ages 6 to 17 years
Estonian Unemployment Among Women with Children Ages 6 to 17 years
9.3%
UNEMPLOYMENT | WOMEN W/ CHILDREN 6 TO 17
4.4/ 100
METRIC RATING
228th/ 347
METRIC RANK
Estonian Unemployment Among Women with Children Ages 6 to 17 years Correlation Chart
The statistical analysis conducted on geographies consisting of 102,254,464 people shows a moderate positive correlation between the proportion of Estonians and unemployment rate among women with children between the ages 6 and 17 in the United States with a correlation coefficient (R) of 0.422 and weighted average of 9.3%. On average, for every 1% (one percent) increase in Estonians within a typical geography, there is an increase of 7.9% in unemployment rate among women with children between the ages 6 and 17.
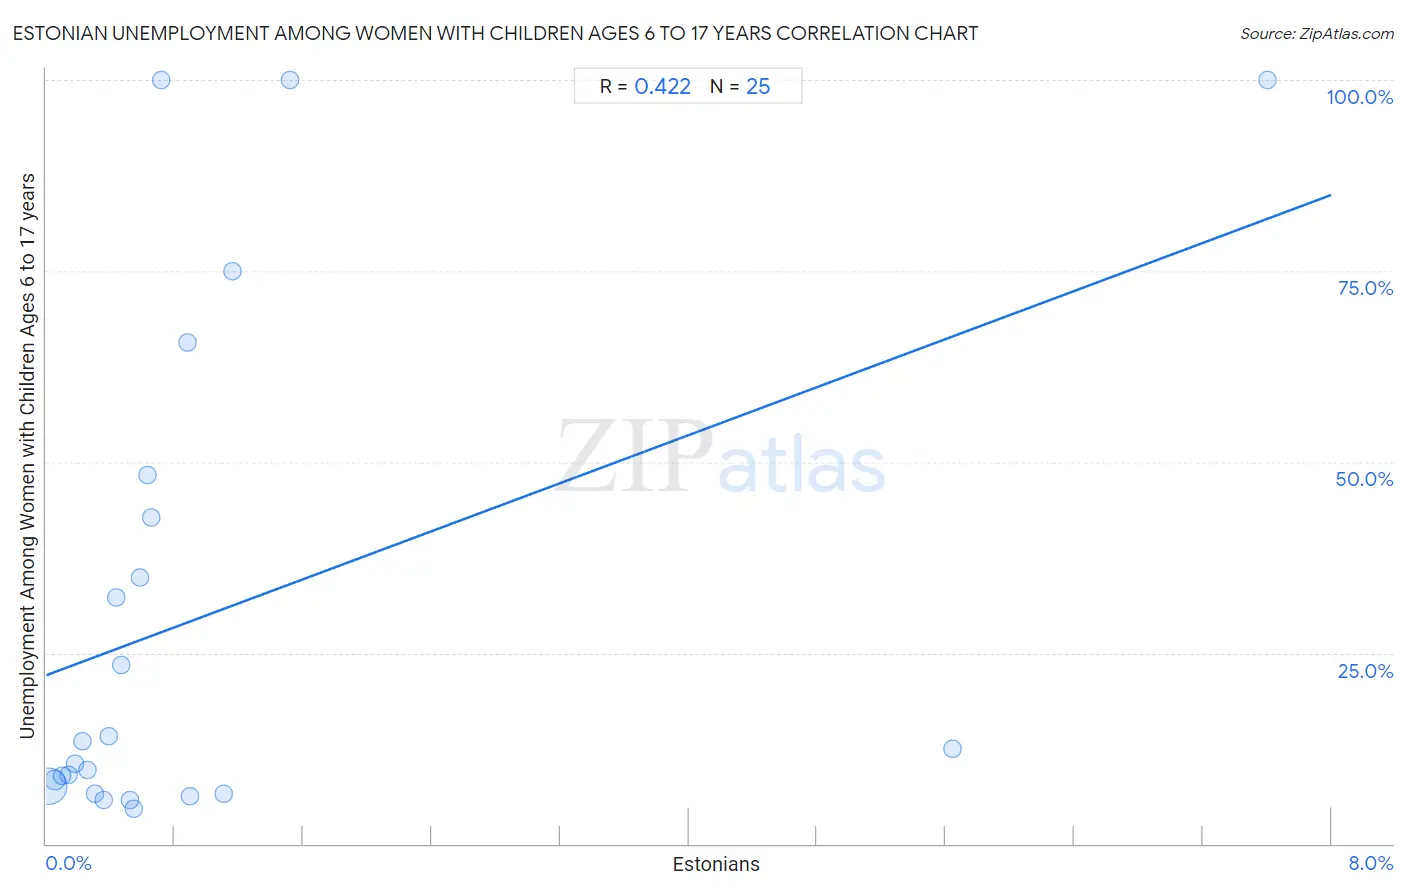
It is essential to understand that the correlation between the percentage of Estonians and unemployment rate among women with children between the ages 6 and 17 does not imply a direct cause-and-effect relationship. It remains uncertain whether the presence of Estonians influences an upward or downward trend in the level of unemployment rate among women with children between the ages 6 and 17 within an area, or if Estonians simply ended up residing in those areas with higher or lower levels of unemployment rate among women with children between the ages 6 and 17 due to other factors.
Demographics Similar to Estonians by Unemployment Among Women with Children Ages 6 to 17 years
In terms of unemployment among women with children ages 6 to 17 years, the demographic groups most similar to Estonians are Panamanian (9.3%, a difference of 0.020%), Lumbee (9.3%, a difference of 0.030%), Immigrants from the Azores (9.3%, a difference of 0.050%), Welsh (9.3%, a difference of 0.13%), and Macedonian (9.3%, a difference of 0.14%).
| Demographics | Rating | Rank | Unemployment Among Women with Children Ages 6 to 17 years |
| Crow | 5.8 /100 | #221 | Tragic 9.2% |
| Immigrants from Southern Europe | 5.8 /100 | #222 | Tragic 9.2% |
| Immigrants from Eritrea | 5.8 /100 | #223 | Tragic 9.2% |
| Immigrants from El Salvador | 5.3 /100 | #224 | Tragic 9.3% |
| Chinese | 5.2 /100 | #225 | Tragic 9.3% |
| Immigrants from the Azores | 4.6 /100 | #226 | Tragic 9.3% |
| Panamanians | 4.5 /100 | #227 | Tragic 9.3% |
| Estonians | 4.4 /100 | #228 | Tragic 9.3% |
| Lumbee | 4.3 /100 | #229 | Tragic 9.3% |
| Welsh | 4.0 /100 | #230 | Tragic 9.3% |
| Macedonians | 3.9 /100 | #231 | Tragic 9.3% |
| French American Indians | 3.7 /100 | #232 | Tragic 9.3% |
| Immigrants from St. Vincent and the Grenadines | 3.3 /100 | #233 | Tragic 9.3% |
| Mexicans | 3.2 /100 | #234 | Tragic 9.3% |
| Uruguayans | 3.0 /100 | #235 | Tragic 9.3% |
Estonian Unemployment Among Women with Children Ages 6 to 17 years Correlation Summary
| Measurement | Estonian Data | Unemployment Among Women with Children Ages 6 to 17 years Data |
| Minimum | 0.013% | 4.5% |
| Maximum | 7.6% | 100.0% |
| Range | 7.6% | 95.5% |
| Mean | 1.0% | 30.0% |
| Median | 0.52% | 12.5% |
| Interquartile 25% (IQ1) | 0.24% | 7.0% |
| Interquartile 75% (IQ3) | 0.89% | 45.5% |
| Interquartile Range (IQR) | 0.65% | 38.5% |
| Standard Deviation (Sample) | 1.8% | 32.6% |
| Standard Deviation (Population) | 1.7% | 32.0% |
Correlation Details
| Estonian Percentile | Sample Size | Unemployment Among Women with Children Ages 6 to 17 years |
[ 0.0% - 0.5% ] 0.013% | 84,056,503 | 7.4% |
[ 0.0% - 0.5% ] 0.057% | 11,026,254 | 8.3% |
[ 0.0% - 0.5% ] 0.099% | 3,976,985 | 8.9% |
[ 0.0% - 0.5% ] 0.14% | 1,351,924 | 9.0% |
[ 0.0% - 0.5% ] 0.18% | 573,458 | 10.5% |
[ 0.0% - 0.5% ] 0.22% | 258,465 | 13.5% |
[ 0.0% - 0.5% ] 0.26% | 293,828 | 9.6% |
[ 0.0% - 0.5% ] 0.31% | 245,385 | 6.5% |
[ 0.0% - 0.5% ] 0.36% | 72,068 | 5.8% |
[ 0.0% - 0.5% ] 0.39% | 189,463 | 14.1% |
[ 0.0% - 0.5% ] 0.44% | 35,368 | 32.2% |
[ 0.0% - 0.5% ] 0.47% | 48,730 | 23.5% |
[ 0.5% - 1.0% ] 0.52% | 6,359 | 5.7% |
[ 0.5% - 1.0% ] 0.54% | 58,417 | 4.5% |
[ 0.5% - 1.0% ] 0.58% | 12,138 | 34.8% |
[ 0.5% - 1.0% ] 0.63% | 7,810 | 48.3% |
[ 0.5% - 1.0% ] 0.66% | 9,286 | 42.7% |
[ 0.5% - 1.0% ] 0.72% | 1,815 | 100.0% |
[ 0.5% - 1.0% ] 0.88% | 2,733 | 65.6% |
[ 0.5% - 1.0% ] 0.89% | 6,495 | 6.3% |
[ 1.0% - 1.5% ] 1.10% | 10,525 | 6.5% |
[ 1.0% - 1.5% ] 1.16% | 6,199 | 75.0% |
[ 1.5% - 2.0% ] 1.51% | 3,500 | 100.0% |
[ 5.5% - 6.0% ] 5.64% | 585 | 12.5% |
[ 7.5% - 8.0% ] 7.60% | 171 | 100.0% |