Estonian Wage/Income Gap

COMPARE

Estonian
Race
Ancestry
AfghanAfricanAlaska NativeAlaskan AthabascanAlbanianAleutAlsatianAmericanApacheArabArapahoArgentineanArmenianAssyrian/Chaldean/SyriacAustralianAustrianBahamianBangladeshiBarbadianBasqueBelgianBelizeanBermudanBhutaneseBlackfeetBolivianBrazilianBritishBritish West IndianBulgarianBurmeseCajunCambodianCanadianCape VerdeanCarpatho RusynCelticCentral AmericanCentral American IndianCherokeeCheyenneChickasawChileanChineseChippewaChoctawColombianColvilleComancheCosta RicanCreeCreekCroatianCrowCubanCypriotCzechCzechoslovakianDanishDelawareDominicanDutchDutch West IndianEastern EuropeanEcuadorianEgyptianEnglishEstonianEthiopianEuropeanFijianFilipinoFinnishFrenchFrench American IndianFrench CanadianGermanGerman RussianGhanaianGreekGuamanian/ChamorroGuatemalanGuyaneseHaitianHmongHonduranHopiHoumaHungarianIcelanderIndian (Asian)IndonesianInupiatIranianIraqiIrishIroquoisIsraeliItalianJamaicanJapaneseJordanianKenyanKiowaKoreanLaotianLatvianLebaneseLiberianLithuanianLumbeeLuxembourgerMacedonianMalaysianMalteseMarshalleseMenomineeMexicanMexican American IndianMongolianMoroccanNative HawaiianNavajoNepaleseNew ZealanderNicaraguanNigerianNorthern EuropeanNorwegianOkinawanOsageOttawaPaiutePakistaniPalestinianPanamanianParaguayanPennsylvania GermanPeruvianPimaPolishPortuguesePotawatomiPuebloPuerto RicanPuget Sound SalishRomanianRussianSalvadoranSamoanScandinavianScotch-IrishScottishSeminoleSenegaleseSerbianShoshoneSierra LeoneanSiouxSlavicSlovakSloveneSomaliSouth AfricanSouth AmericanSouth American IndianSoviet UnionSpaniardSpanishSpanish AmericanSpanish American IndianSri LankanSubsaharan AfricanSudaneseSwedishSwissSyrianTaiwaneseThaiTlingit-HaidaTohono O'OdhamTonganTrinidadian and TobagonianTsimshianTurkishU.S. Virgin IslanderUgandanUkrainianUruguayanUteVenezuelanVietnameseWelshWest IndianYakamaYaquiYugoslavianYumanYup'ikZimbabwean
Immigration
NonimmigrantsImmigrantsAfghanistanAfricaAlbaniaArgentinaArmeniaAsiaAustraliaAustriaBahamasBangladeshBarbadosBelarusBelgiumBelizeBoliviaBosnia and HerzegovinaBrazilBulgariaBurma/MyanmarCabo VerdeCambodiaCameroonCanadaCaribbeanCentral AmericaChileChinaColombiaCongoCosta RicaCroatiaCubaCzechoslovakiaDenmarkDominicaDominican RepublicEastern AfricaEastern AsiaEastern EuropeEcuadorEgyptEl SalvadorEnglandEritreaEthiopiaEuropeFijiFranceGermanyGhanaGreeceGrenadaGuatemalaGuyanaHaitiHondurasHong KongHungaryIndiaIndonesiaIranIraqIrelandIsraelItalyJamaicaJapanJordanKazakhstanKenyaKoreaKuwaitLaosLatin AmericaLatviaLebanonLiberiaLithuaniaMalaysiaMexicoMicronesiaMiddle AfricaMoldovaMoroccoNepalNetherlandsNicaraguaNigeriaNorth AmericaNorth MacedoniaNorthern AfricaNorthern EuropeNorwayOceaniaPakistanPanamaPeruPhilippinesPolandPortugalRomaniaRussiaSaudi ArabiaScotlandSenegalSerbiaSierra LeoneSingaporeSomaliaSouth AfricaSouth AmericaSouth Central AsiaSouth Eastern AsiaSouthern EuropeSpainSri LankaSt. Vincent and the GrenadinesSudanSwedenSwitzerlandSyriaTaiwanThailandTrinidad and TobagoTurkeyUgandaUkraineUruguayUzbekistanVenezuelaVietnamWest IndiesWestern AfricaWestern AsiaWestern EuropeYemenZaireZimbabweAzores
Select to Compare
Race
Ancestry
AfghanAfricanAlaska NativeAlaskan AthabascanAlbanianAleutAlsatianAmericanApacheArabArapahoArgentineanArmenianAssyrian/Chaldean/SyriacAustralianAustrianBahamianBangladeshiBarbadianBasqueBelgianBelizeanBermudanBhutaneseBlackfeetBolivianBrazilianBritishBritish West IndianBulgarianBurmeseCajunCambodianCanadianCape VerdeanCarpatho RusynCelticCentral AmericanCentral American IndianCherokeeCheyenneChickasawChileanChineseChippewaChoctawColombianColvilleComancheCosta RicanCreeCreekCroatianCrowCubanCypriotCzechCzechoslovakianDanishDelawareDominicanDutchDutch West IndianEastern EuropeanEcuadorianEgyptianEnglishEthiopianEuropeanFijianFilipinoFinnishFrenchFrench American IndianFrench CanadianGermanGerman RussianGhanaianGreekGuamanian/ChamorroGuatemalanGuyaneseHaitianHmongHonduranHopiHoumaHungarianIcelanderIndian (Asian)IndonesianInupiatIranianIraqiIrishIroquoisIsraeliItalianJamaicanJapaneseJordanianKenyanKiowaKoreanLaotianLatvianLebaneseLiberianLithuanianLumbeeLuxembourgerMacedonianMalaysianMalteseMarshalleseMenomineeMexicanMexican American IndianMongolianMoroccanNative HawaiianNavajoNepaleseNew ZealanderNicaraguanNigerianNorthern EuropeanNorwegianOkinawanOsageOttawaPaiutePakistaniPalestinianPanamanianParaguayanPennsylvania GermanPeruvianPimaPolishPortuguesePotawatomiPuebloPuerto RicanPuget Sound SalishRomanianRussianSalvadoranSamoanScandinavianScotch-IrishScottishSeminoleSenegaleseSerbianShoshoneSierra LeoneanSiouxSlavicSlovakSloveneSomaliSouth AfricanSouth AmericanSouth American IndianSoviet UnionSpaniardSpanishSpanish AmericanSpanish American IndianSri LankanSubsaharan AfricanSudaneseSwedishSwissSyrianTaiwaneseThaiTlingit-HaidaTohono O'OdhamTonganTrinidadian and TobagonianTsimshianTurkishU.S. Virgin IslanderUgandanUkrainianUruguayanUteVenezuelanVietnameseWelshWest IndianYakamaYaquiYugoslavianYumanYup'ikZimbabwean
Immigration
NonimmigrantsImmigrantsAfghanistanAfricaAlbaniaArgentinaArmeniaAsiaAustraliaAustriaBahamasBangladeshBarbadosBelarusBelgiumBelizeBoliviaBosnia and HerzegovinaBrazilBulgariaBurma/MyanmarCabo VerdeCambodiaCameroonCanadaCaribbeanCentral AmericaChileChinaColombiaCongoCosta RicaCroatiaCubaCzechoslovakiaDenmarkDominicaDominican RepublicEastern AfricaEastern AsiaEastern EuropeEcuadorEgyptEl SalvadorEnglandEritreaEthiopiaEuropeFijiFranceGermanyGhanaGreeceGrenadaGuatemalaGuyanaHaitiHondurasHong KongHungaryIndiaIndonesiaIranIraqIrelandIsraelItalyJamaicaJapanJordanKazakhstanKenyaKoreaKuwaitLaosLatin AmericaLatviaLebanonLiberiaLithuaniaMalaysiaMexicoMicronesiaMiddle AfricaMoldovaMoroccoNepalNetherlandsNicaraguaNigeriaNorth AmericaNorth MacedoniaNorthern AfricaNorthern EuropeNorwayOceaniaPakistanPanamaPeruPhilippinesPolandPortugalRomaniaRussiaSaudi ArabiaScotlandSenegalSerbiaSierra LeoneSingaporeSomaliaSouth AfricaSouth AmericaSouth Central AsiaSouth Eastern AsiaSouthern EuropeSpainSri LankaSt. Vincent and the GrenadinesSudanSwedenSwitzerlandSyriaTaiwanThailandTrinidad and TobagoTurkeyUgandaUkraineUruguayUzbekistanVenezuelaVietnamWest IndiesWestern AfricaWestern AsiaWestern EuropeYemenZaireZimbabweAzores
Wage/Income Gap
Income
Poverty
Unemployment
Labor Participation
Family Structure
Vehicle Availability
Education Level
Disability

Estonian Wage/Income Gap
Tragic

27.1%
WAGE/INCOME GAP
4.3/ 100
METRIC RATING
239th/ 347
METRIC RANK

Estonian Wage/Income Gap Correlation Chart

The statistical analysis conducted on geographies consisting of 123,494,549 people shows a slight positive correlation between the proportion of Estonians and wage/income gap percentage in the United States with a correlation coefficient (R) of 0.080 and weighted average of 27.1%. On average, for every 1% (one percent) increase in Estonians within a typical geography, there is an increase of 0.74% in wage/income gap percentage.
Estonian Wage/Income Gap
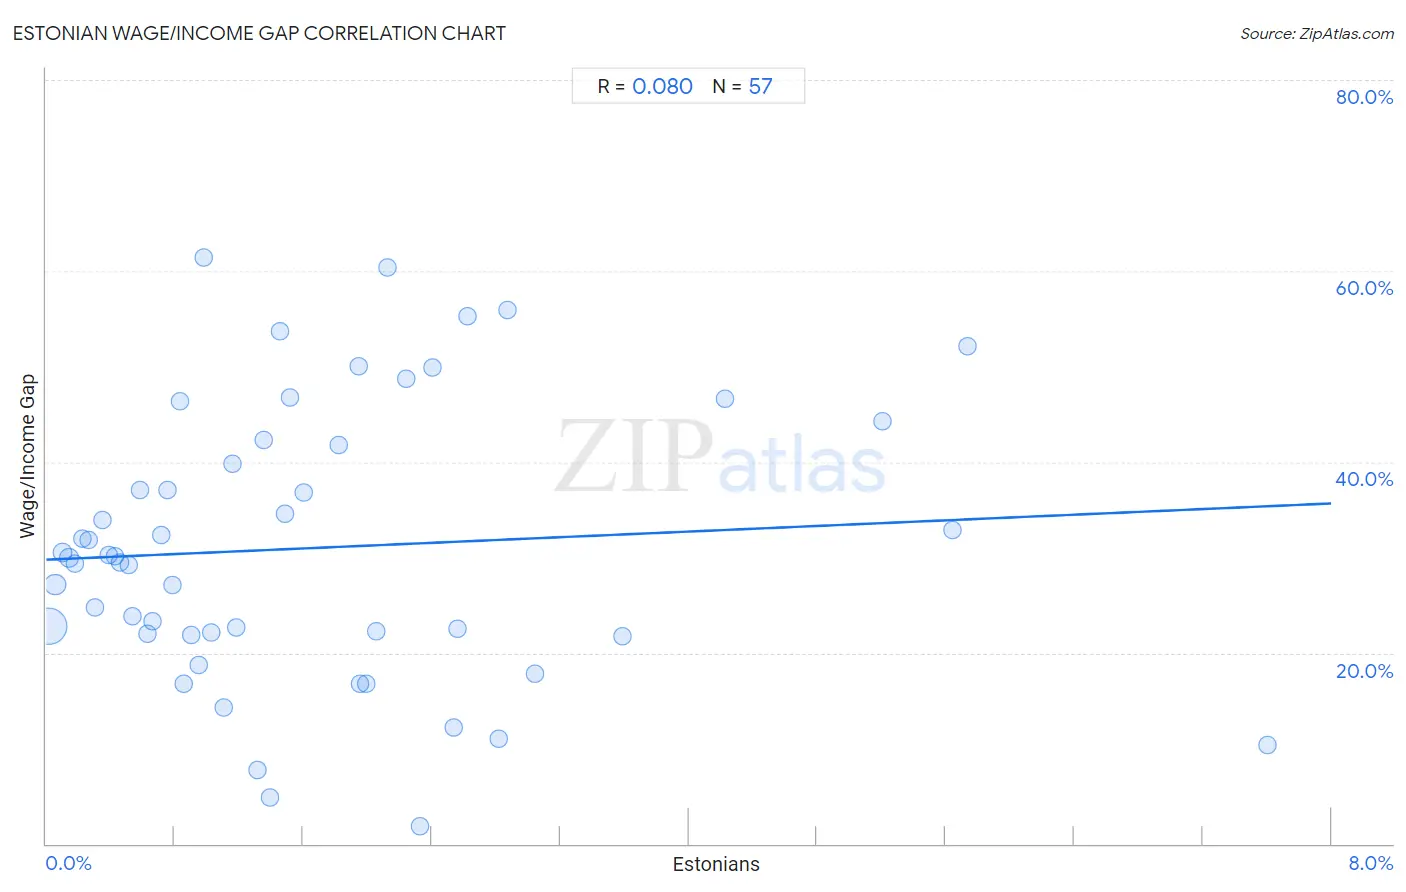
It is essential to understand that the correlation between the percentage of Estonians and wage/income gap percentage does not imply a direct cause-and-effect relationship. It remains uncertain whether the presence of Estonians influences an upward or downward trend in the level of wage/income gap percentage within an area, or if Estonians simply ended up residing in those areas with higher or lower levels of wage/income gap percentage due to other factors.

Demographics Similar to Estonians by Wage/Income Gap

In terms of wage/income gap, the demographic groups most similar to Estonians are Osage (27.1%, a difference of 0.020%), Immigrants from Eastern Asia (27.1%, a difference of 0.030%), Immigrants from Romania (27.0%, a difference of 0.17%), Immigrants from Europe (27.1%, a difference of 0.18%), and Immigrants from Hungary (27.0%, a difference of 0.19%).
DemographicsRating | RankWage/Income Gap
Argentineans
5.2
/100
|
#232
Tragic
27.0%
Immigrants from Brazil
5.0
/100
|
#233
Tragic
27.0%
Immigrants from Pakistan
4.9
/100
|
#234
Tragic
27.0%
Immigrants from Hungary
4.8
/100
|
#235
Tragic
27.0%
Immigrants from Romania
4.8
/100
|
#236
Tragic
27.0%
Immigrants from Eastern Asia
4.4
/100
|
#237
Tragic
27.1%
Osage
4.4
/100
|
#238
Tragic
27.1%
Estonians
4.3
/100
|
#239
Tragic
27.1%
Immigrants from Europe
3.8
/100
|
#240
Tragic
27.1%
Creek
3.8
/100
|
#241
Tragic
27.1%
Immigrants from Sri Lanka
3.7
/100
|
#242
Tragic
27.1%
Spanish
3.6
/100
|
#243
Tragic
27.1%
Chickasaw
3.5
/100
|
#244
Tragic
27.2%
Immigrants from the Azores
3.5
/100
|
#245
Tragic
27.2%
Nonimmigrants
3.3
/100
|
#246
Tragic
27.2%

Estonian Wage/Income Gap Correlation Summary

MeasurementEstonian DataWage/Income Gap Data
Minimum0.014%1.9%
Maximum7.6%61.4%
Range7.6%59.5%
Mean1.7%31.0%
Median1.2%29.9%
Interquartile 25% (IQ1)0.56%22.0%
Interquartile 75% (IQ3)2.3%42.0%
Interquartile Range (IQR)1.7%20.1%
Standard Deviation (Sample)1.6%14.4%
Standard Deviation (Population)1.6%14.3%

Correlation Details

Estonian PercentileSample SizeWage/Income Gap
[
0.0%
-
0.5%
]
0.014%
93,128,97022.8%
[
0.0%
-
0.5%
]
0.057%
16,418,53427.1%
[
0.0%
-
0.5%
]
0.099%
5,986,61030.5%
[
0.0%
-
0.5%
]
0.14%
3,138,93229.9%
[
0.0%
-
0.5%
]
0.18%
1,326,67029.4%
[
0.0%
-
0.5%
]
0.22%
1,022,04332.0%
[
0.0%
-
0.5%
]
0.26%
594,16631.8%
[
0.0%
-
0.5%
]
0.30%
432,45724.8%
[
0.0%
-
0.5%
]
0.35%
150,98133.9%
[
0.0%
-
0.5%
]
0.39%
284,44730.2%
[
0.0%
-
0.5%
]
0.43%
154,81930.2%
[
0.0%
-
0.5%
]
0.46%
162,51129.5%
[
0.5%
-
1.0%
]
0.51%
90,24329.2%
[
0.5%
-
1.0%
]
0.54%
103,77023.9%
[
0.5%
-
1.0%
]
0.59%
52,94237.1%
[
0.5%
-
1.0%
]
0.63%
59,46922.0%
[
0.5%
-
1.0%
]
0.66%
56,16023.3%
[
0.5%
-
1.0%
]
0.71%
15,10732.3%
[
0.5%
-
1.0%
]
0.76%
23,57537.0%
[
0.5%
-
1.0%
]
0.79%
22,27927.1%
[
0.5%
-
1.0%
]
0.83%
5,40646.3%
[
0.5%
-
1.0%
]
0.86%
73,56316.7%
[
0.5%
-
1.0%
]
0.90%
16,00721.9%
[
0.5%
-
1.0%
]
0.95%
16,63618.7%
[
0.5%
-
1.0%
]
0.98%
4,50461.4%
[
1.0%
-
1.5%
]
1.03%
1,36422.2%
[
1.0%
-
1.5%
]
1.11%
22,51914.3%
[
1.0%
-
1.5%
]
1.16%
8,01239.8%
[
1.0%
-
1.5%
]
1.18%
5,06722.7%
[
1.0%
-
1.5%
]
1.31%
15,5427.7%
[
1.0%
-
1.5%
]
1.35%
10,13142.3%
[
1.0%
-
1.5%
]
1.40%
5,7304.8%
[
1.0%
-
1.5%
]
1.46%
1,30453.7%
[
1.0%
-
1.5%
]
1.49%
4,37134.5%
[
1.5%
-
2.0%
]
1.51%
3,50046.7%
[
1.5%
-
2.0%
]
1.61%
13,08036.8%
[
1.5%
-
2.0%
]
1.82%
8,85141.8%
[
1.5%
-
2.0%
]
1.94%
1,49350.1%
[
1.5%
-
2.0%
]
1.95%
7,41716.8%
[
1.5%
-
2.0%
]
1.99%
8,43016.7%
[
2.0%
-
2.5%
]
2.05%
15,59922.2%
[
2.0%
-
2.5%
]
2.13%
56460.4%
[
2.0%
-
2.5%
]
2.24%
1,29448.7%
[
2.0%
-
2.5%
]
2.33%
4721.9%
[
2.0%
-
2.5%
]
2.40%
87449.9%
[
2.5%
-
3.0%
]
2.54%
3,82212.2%
[
2.5%
-
3.0%
]
2.56%
3,04322.5%
[
2.5%
-
3.0%
]
2.62%
1,14555.3%
[
2.5%
-
3.0%
]
2.82%
3,44111.0%
[
2.5%
-
3.0%
]
2.87%
1,04556.0%
[
3.0%
-
3.5%
]
3.04%
1,54417.8%
[
3.5%
-
4.0%
]
3.59%
2,28621.7%
[
4.0%
-
4.5%
]
4.23%
21346.6%
[
5.0%
-
5.5%
]
5.21%
59544.3%
[
5.5%
-
6.0%
]
5.64%
58532.9%
[
5.5%
-
6.0%
]
5.74%
24452.1%
[
7.5%
-
8.0%
]
7.60%
17110.3%