Estonian GED/Equivalency
COMPARE
Estonian
Select to Compare
GED/Equivalency
Estonian GED/Equivalency
88.6%
GED/EQUIVALENCY
99.8/ 100
METRIC RATING
25th/ 347
METRIC RANK
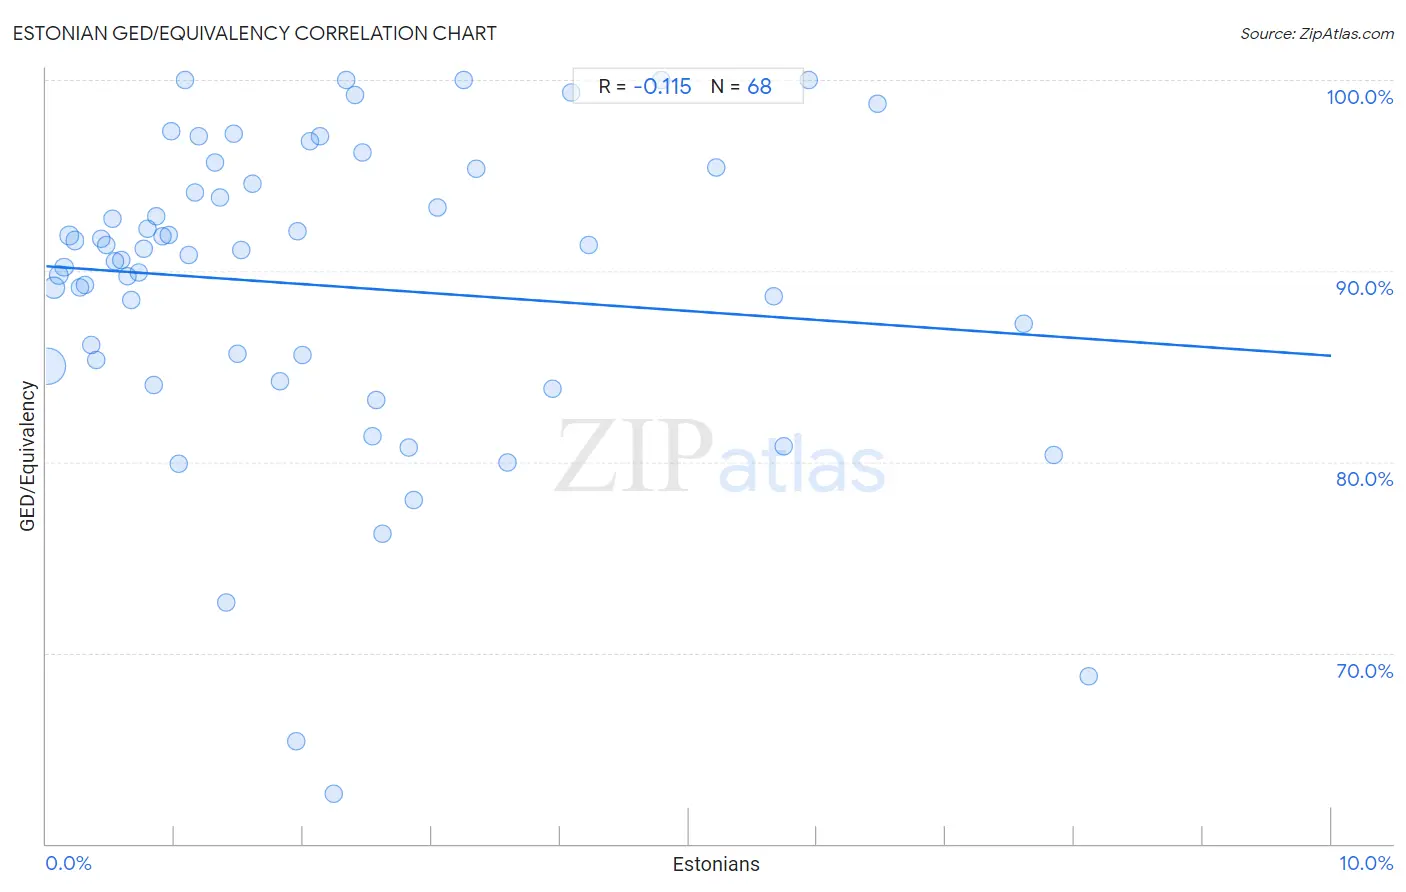
Estonian GED/Equivalency Correlation Chart
The statistical analysis conducted on geographies consisting of 123,527,724 people shows a poor negative correlation between the proportion of Estonians and percentage of population with at least ged/equivalency education in the United States with a correlation coefficient (R) of -0.115 and weighted average of 88.6%. On average, for every 1% (one percent) increase in Estonians within a typical geography, there is a decrease of 0.47% in percentage of population with at least ged/equivalency education.
It is essential to understand that the correlation between the percentage of Estonians and percentage of population with at least ged/equivalency education does not imply a direct cause-and-effect relationship. It remains uncertain whether the presence of Estonians influences an upward or downward trend in the level of percentage of population with at least ged/equivalency education within an area, or if Estonians simply ended up residing in those areas with higher or lower levels of percentage of population with at least ged/equivalency education due to other factors.
Demographics Similar to Estonians by GED/Equivalency
In terms of ged/equivalency, the demographic groups most similar to Estonians are Russian (88.6%, a difference of 0.0%), Slovak (88.6%, a difference of 0.0%), Immigrants from Australia (88.6%, a difference of 0.0%), Immigrants from Ireland (88.6%, a difference of 0.020%), and Luxembourger (88.6%, a difference of 0.030%).
| Demographics | Rating | Rank | GED/Equivalency |
| Slovenes | 99.9 /100 | #18 | Exceptional 88.8% |
| Swedes | 99.9 /100 | #19 | Exceptional 88.8% |
| Maltese | 99.9 /100 | #20 | Exceptional 88.6% |
| Luxembourgers | 99.8 /100 | #21 | Exceptional 88.6% |
| Immigrants from Ireland | 99.8 /100 | #22 | Exceptional 88.6% |
| Russians | 99.8 /100 | #23 | Exceptional 88.6% |
| Slovaks | 99.8 /100 | #24 | Exceptional 88.6% |
| Estonians | 99.8 /100 | #25 | Exceptional 88.6% |
| Immigrants from Australia | 99.8 /100 | #26 | Exceptional 88.6% |
| Immigrants from Lithuania | 99.8 /100 | #27 | Exceptional 88.6% |
| Immigrants from Northern Europe | 99.8 /100 | #28 | Exceptional 88.5% |
| Poles | 99.8 /100 | #29 | Exceptional 88.5% |
| Turks | 99.8 /100 | #30 | Exceptional 88.5% |
| Bhutanese | 99.8 /100 | #31 | Exceptional 88.4% |
| Danes | 99.8 /100 | #32 | Exceptional 88.4% |
Estonian GED/Equivalency Correlation Summary
| Measurement | Estonian Data | GED/Equivalency Data |
| Minimum | 0.014% | 62.6% |
| Maximum | 8.1% | 100.0% |
| Range | 8.1% | 37.4% |
| Mean | 2.1% | 89.2% |
| Median | 1.5% | 91.0% |
| Interquartile 25% (IQ1) | 0.69% | 85.2% |
| Interquartile 75% (IQ3) | 2.8% | 94.9% |
| Interquartile Range (IQR) | 2.2% | 9.8% |
| Standard Deviation (Sample) | 2.0% | 8.1% |
| Standard Deviation (Population) | 2.0% | 8.1% |
Correlation Details
| Estonian Percentile | Sample Size | GED/Equivalency |
[ 0.0% - 0.5% ] 0.014% | 93,128,970 | 85.0% |
[ 0.0% - 0.5% ] 0.057% | 16,418,534 | 89.1% |
[ 0.0% - 0.5% ] 0.099% | 5,986,610 | 89.8% |
[ 0.0% - 0.5% ] 0.14% | 3,140,364 | 90.2% |
[ 0.0% - 0.5% ] 0.18% | 1,327,187 | 91.9% |
[ 0.0% - 0.5% ] 0.22% | 1,026,788 | 91.6% |
[ 0.0% - 0.5% ] 0.26% | 594,166 | 89.2% |
[ 0.0% - 0.5% ] 0.30% | 432,457 | 89.2% |
[ 0.0% - 0.5% ] 0.35% | 151,838 | 86.1% |
[ 0.0% - 0.5% ] 0.39% | 284,971 | 85.3% |
[ 0.0% - 0.5% ] 0.43% | 154,819 | 91.7% |
[ 0.0% - 0.5% ] 0.46% | 167,368 | 91.4% |
[ 0.5% - 1.0% ] 0.51% | 93,892 | 92.7% |
[ 0.5% - 1.0% ] 0.54% | 103,770 | 90.5% |
[ 0.5% - 1.0% ] 0.59% | 53,292 | 90.6% |
[ 0.5% - 1.0% ] 0.63% | 60,767 | 89.7% |
[ 0.5% - 1.0% ] 0.66% | 56,901 | 88.5% |
[ 0.5% - 1.0% ] 0.72% | 16,922 | 89.9% |
[ 0.5% - 1.0% ] 0.76% | 23,575 | 91.1% |
[ 0.5% - 1.0% ] 0.79% | 22,279 | 92.2% |
[ 0.5% - 1.0% ] 0.83% | 5,406 | 84.0% |
[ 0.5% - 1.0% ] 0.86% | 76,168 | 92.9% |
[ 0.5% - 1.0% ] 0.90% | 16,440 | 91.8% |
[ 0.5% - 1.0% ] 0.95% | 16,636 | 91.9% |
[ 0.5% - 1.0% ] 0.98% | 4,913 | 97.3% |
[ 1.0% - 1.5% ] 1.03% | 1,364 | 79.9% |
[ 1.0% - 1.5% ] 1.08% | 837 | 100.0% |
[ 1.0% - 1.5% ] 1.11% | 22,519 | 90.8% |
[ 1.0% - 1.5% ] 1.16% | 8,012 | 94.1% |
[ 1.0% - 1.5% ] 1.18% | 5,067 | 97.0% |
[ 1.0% - 1.5% ] 1.31% | 15,542 | 95.7% |
[ 1.0% - 1.5% ] 1.35% | 10,131 | 93.8% |
[ 1.0% - 1.5% ] 1.40% | 5,730 | 72.7% |
[ 1.0% - 1.5% ] 1.46% | 1,304 | 97.2% |
[ 1.0% - 1.5% ] 1.49% | 4,371 | 85.7% |
[ 1.5% - 2.0% ] 1.51% | 3,500 | 91.1% |
[ 1.5% - 2.0% ] 1.61% | 13,080 | 94.5% |
[ 1.5% - 2.0% ] 1.82% | 8,851 | 84.2% |
[ 1.5% - 2.0% ] 1.94% | 1,493 | 65.4% |
[ 1.5% - 2.0% ] 1.95% | 7,417 | 92.1% |
[ 1.5% - 2.0% ] 1.99% | 8,430 | 85.6% |
[ 2.0% - 2.5% ] 2.05% | 15,599 | 96.8% |
[ 2.0% - 2.5% ] 2.13% | 564 | 97.0% |
[ 2.0% - 2.5% ] 2.24% | 1,294 | 62.6% |
[ 2.0% - 2.5% ] 2.33% | 472 | 100.0% |
[ 2.0% - 2.5% ] 2.40% | 874 | 99.2% |
[ 2.0% - 2.5% ] 2.46% | 1,300 | 96.2% |
[ 2.5% - 3.0% ] 2.54% | 3,822 | 81.3% |
[ 2.5% - 3.0% ] 2.56% | 3,043 | 83.2% |
[ 2.5% - 3.0% ] 2.62% | 1,145 | 76.2% |
[ 2.5% - 3.0% ] 2.82% | 3,441 | 80.7% |
[ 2.5% - 3.0% ] 2.86% | 1,362 | 78.0% |
[ 3.0% - 3.5% ] 3.04% | 1,544 | 93.3% |
[ 3.0% - 3.5% ] 3.25% | 154 | 100.0% |
[ 3.0% - 3.5% ] 3.35% | 418 | 95.3% |
[ 3.5% - 4.0% ] 3.59% | 2,286 | 80.0% |
[ 3.5% - 4.0% ] 3.94% | 1,067 | 83.9% |
[ 4.0% - 4.5% ] 4.08% | 1,567 | 99.3% |
[ 4.0% - 4.5% ] 4.23% | 213 | 91.4% |
[ 4.5% - 5.0% ] 4.79% | 355 | 100.0% |
[ 5.0% - 5.5% ] 5.21% | 595 | 95.4% |
[ 5.5% - 6.0% ] 5.66% | 1,838 | 88.7% |
[ 5.5% - 6.0% ] 5.74% | 244 | 80.8% |
[ 5.5% - 6.0% ] 5.93% | 118 | 100.0% |
[ 6.0% - 6.5% ] 6.47% | 1,113 | 98.8% |
[ 7.5% - 8.0% ] 7.60% | 171 | 87.3% |
[ 7.5% - 8.0% ] 7.84% | 370 | 80.4% |
[ 8.0% - 8.5% ] 8.11% | 74 | 68.8% |