Estonian College, 1 year or more
COMPARE
Estonian
Select to Compare
College, 1 year or more
Estonian College, 1 year or more
65.0%
COLLEGE, 1 YEAR OR MORE
99.9/ 100
METRIC RATING
39th/ 347
METRIC RANK
Estonian College, 1 year or more Correlation Chart
The statistical analysis conducted on geographies consisting of 123,528,478 people shows a weak negative correlation between the proportion of Estonians and percentage of population with at least college, 1 year or more education in the United States with a correlation coefficient (R) of -0.276 and weighted average of 65.0%. On average, for every 1% (one percent) increase in Estonians within a typical geography, there is a decrease of 2.0% in percentage of population with at least college, 1 year or more education.
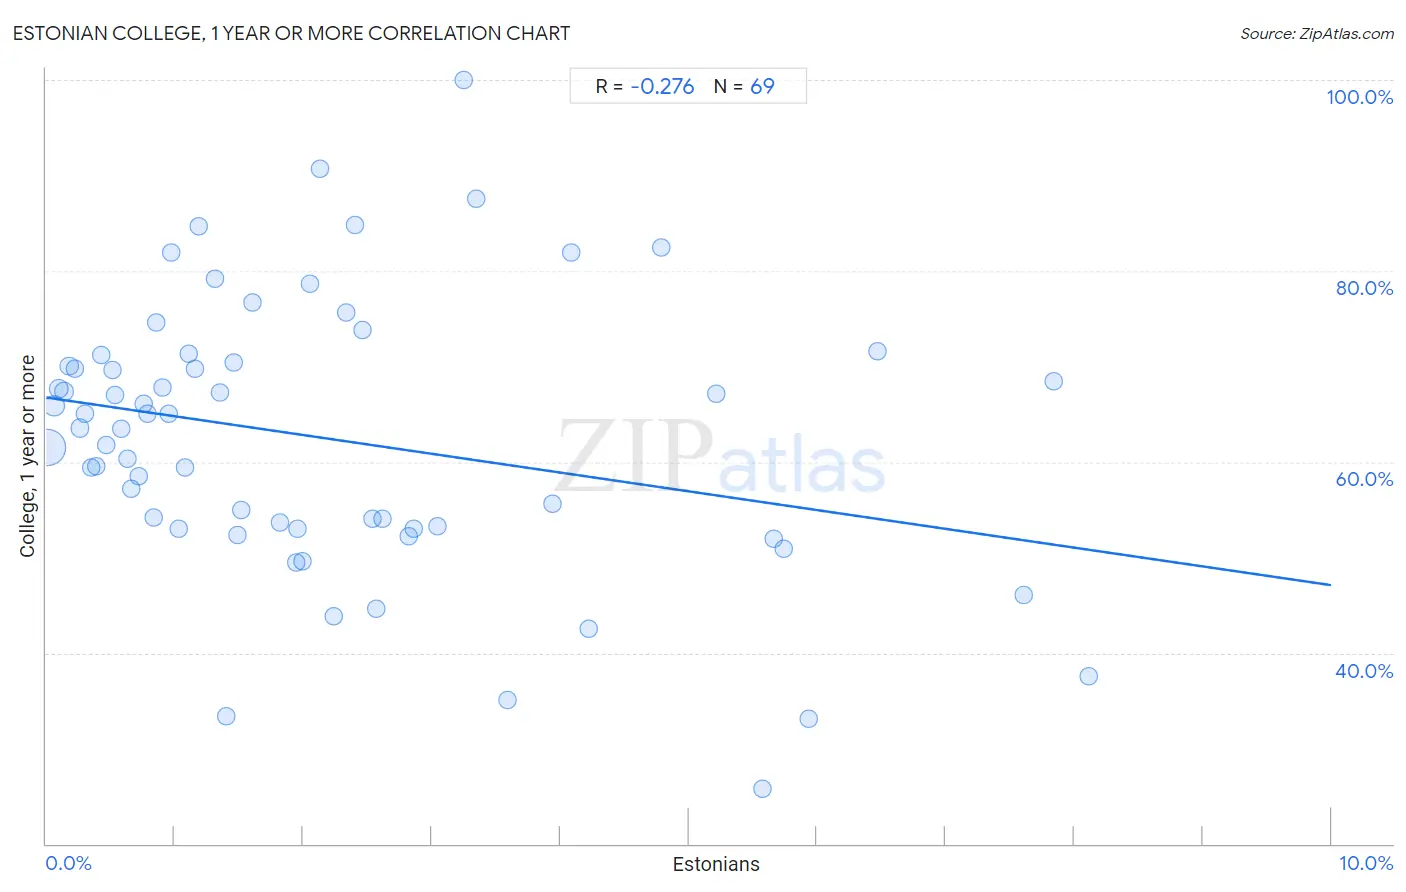
It is essential to understand that the correlation between the percentage of Estonians and percentage of population with at least college, 1 year or more education does not imply a direct cause-and-effect relationship. It remains uncertain whether the presence of Estonians influences an upward or downward trend in the level of percentage of population with at least college, 1 year or more education within an area, or if Estonians simply ended up residing in those areas with higher or lower levels of percentage of population with at least college, 1 year or more education due to other factors.
Demographics Similar to Estonians by College, 1 year or more
In terms of college, 1 year or more, the demographic groups most similar to Estonians are Immigrants from Kuwait (65.0%, a difference of 0.060%), Immigrants from Saudi Arabia (65.0%, a difference of 0.070%), Russian (65.1%, a difference of 0.22%), Immigrants from South Africa (65.1%, a difference of 0.23%), and Mongolian (64.8%, a difference of 0.26%).
| Demographics | Rating | Rank | College, 1 year or more |
| Bulgarians | 100.0 /100 | #32 | Exceptional 65.5% |
| Immigrants from Sri Lanka | 99.9 /100 | #33 | Exceptional 65.4% |
| Israelis | 99.9 /100 | #34 | Exceptional 65.3% |
| Immigrants from Turkey | 99.9 /100 | #35 | Exceptional 65.2% |
| Immigrants from South Africa | 99.9 /100 | #36 | Exceptional 65.1% |
| Russians | 99.9 /100 | #37 | Exceptional 65.1% |
| Immigrants from Saudi Arabia | 99.9 /100 | #38 | Exceptional 65.0% |
| Estonians | 99.9 /100 | #39 | Exceptional 65.0% |
| Immigrants from Kuwait | 99.9 /100 | #40 | Exceptional 65.0% |
| Mongolians | 99.9 /100 | #41 | Exceptional 64.8% |
| Immigrants from Latvia | 99.9 /100 | #42 | Exceptional 64.8% |
| Immigrants from Russia | 99.9 /100 | #43 | Exceptional 64.7% |
| Immigrants from Norway | 99.9 /100 | #44 | Exceptional 64.7% |
| Immigrants from Lithuania | 99.9 /100 | #45 | Exceptional 64.6% |
| Bhutanese | 99.9 /100 | #46 | Exceptional 64.6% |
Estonian College, 1 year or more Correlation Summary
| Measurement | Estonian Data | College, 1 year or more Data |
| Minimum | 0.014% | 25.8% |
| Maximum | 8.1% | 100.0% |
| Range | 8.1% | 74.2% |
| Mean | 2.2% | 62.4% |
| Median | 1.5% | 63.5% |
| Interquartile 25% (IQ1) | 0.69% | 53.0% |
| Interquartile 75% (IQ3) | 3.0% | 70.8% |
| Interquartile Range (IQR) | 2.3% | 17.8% |
| Standard Deviation (Sample) | 2.0% | 14.5% |
| Standard Deviation (Population) | 2.0% | 14.4% |
Correlation Details
| Estonian Percentile | Sample Size | College, 1 year or more |
[ 0.0% - 0.5% ] 0.014% | 93,128,970 | 61.5% |
[ 0.0% - 0.5% ] 0.057% | 16,418,534 | 65.9% |
[ 0.0% - 0.5% ] 0.099% | 5,986,610 | 67.7% |
[ 0.0% - 0.5% ] 0.14% | 3,140,364 | 67.4% |
[ 0.0% - 0.5% ] 0.18% | 1,327,187 | 70.0% |
[ 0.0% - 0.5% ] 0.22% | 1,026,788 | 69.8% |
[ 0.0% - 0.5% ] 0.26% | 594,166 | 63.5% |
[ 0.0% - 0.5% ] 0.30% | 432,457 | 65.0% |
[ 0.0% - 0.5% ] 0.35% | 151,838 | 59.4% |
[ 0.0% - 0.5% ] 0.39% | 284,971 | 59.5% |
[ 0.0% - 0.5% ] 0.43% | 154,819 | 71.2% |
[ 0.0% - 0.5% ] 0.46% | 167,368 | 61.8% |
[ 0.5% - 1.0% ] 0.51% | 93,892 | 69.6% |
[ 0.5% - 1.0% ] 0.54% | 103,770 | 67.0% |
[ 0.5% - 1.0% ] 0.59% | 53,292 | 63.5% |
[ 0.5% - 1.0% ] 0.63% | 60,767 | 60.3% |
[ 0.5% - 1.0% ] 0.66% | 56,901 | 57.2% |
[ 0.5% - 1.0% ] 0.72% | 16,922 | 58.5% |
[ 0.5% - 1.0% ] 0.76% | 23,575 | 66.1% |
[ 0.5% - 1.0% ] 0.79% | 22,279 | 65.1% |
[ 0.5% - 1.0% ] 0.83% | 5,406 | 54.2% |
[ 0.5% - 1.0% ] 0.86% | 76,168 | 74.7% |
[ 0.5% - 1.0% ] 0.90% | 16,440 | 67.8% |
[ 0.5% - 1.0% ] 0.95% | 16,636 | 65.1% |
[ 0.5% - 1.0% ] 0.98% | 4,913 | 82.0% |
[ 1.0% - 1.5% ] 1.03% | 1,364 | 53.0% |
[ 1.0% - 1.5% ] 1.08% | 837 | 59.5% |
[ 1.0% - 1.5% ] 1.11% | 22,519 | 71.3% |
[ 1.0% - 1.5% ] 1.16% | 8,012 | 69.7% |
[ 1.0% - 1.5% ] 1.18% | 5,067 | 84.7% |
[ 1.0% - 1.5% ] 1.31% | 15,542 | 79.2% |
[ 1.0% - 1.5% ] 1.35% | 10,131 | 67.3% |
[ 1.0% - 1.5% ] 1.40% | 5,730 | 33.3% |
[ 1.0% - 1.5% ] 1.46% | 1,304 | 70.4% |
[ 1.0% - 1.5% ] 1.49% | 4,371 | 52.4% |
[ 1.5% - 2.0% ] 1.51% | 3,500 | 55.0% |
[ 1.5% - 2.0% ] 1.61% | 13,080 | 76.7% |
[ 1.5% - 2.0% ] 1.82% | 8,851 | 53.7% |
[ 1.5% - 2.0% ] 1.94% | 1,493 | 49.5% |
[ 1.5% - 2.0% ] 1.95% | 7,417 | 53.0% |
[ 1.5% - 2.0% ] 1.99% | 8,430 | 49.6% |
[ 2.0% - 2.5% ] 2.05% | 15,599 | 78.6% |
[ 2.0% - 2.5% ] 2.13% | 564 | 90.6% |
[ 2.0% - 2.5% ] 2.24% | 1,294 | 43.8% |
[ 2.0% - 2.5% ] 2.33% | 472 | 75.7% |
[ 2.0% - 2.5% ] 2.40% | 874 | 84.9% |
[ 2.0% - 2.5% ] 2.46% | 1,300 | 73.9% |
[ 2.5% - 3.0% ] 2.54% | 3,822 | 54.0% |
[ 2.5% - 3.0% ] 2.56% | 3,043 | 44.6% |
[ 2.5% - 3.0% ] 2.62% | 1,145 | 54.0% |
[ 2.5% - 3.0% ] 2.82% | 3,441 | 52.1% |
[ 2.5% - 3.0% ] 2.86% | 1,362 | 53.0% |
[ 3.0% - 3.5% ] 3.04% | 1,544 | 53.3% |
[ 3.0% - 3.5% ] 3.25% | 154 | 100.0% |
[ 3.0% - 3.5% ] 3.35% | 418 | 87.5% |
[ 3.5% - 4.0% ] 3.59% | 2,286 | 35.1% |
[ 3.5% - 4.0% ] 3.94% | 1,067 | 55.6% |
[ 4.0% - 4.5% ] 4.08% | 1,567 | 82.0% |
[ 4.0% - 4.5% ] 4.23% | 213 | 42.5% |
[ 4.5% - 5.0% ] 4.79% | 355 | 82.4% |
[ 5.0% - 5.5% ] 5.21% | 595 | 67.1% |
[ 5.5% - 6.0% ] 5.57% | 754 | 25.8% |
[ 5.5% - 6.0% ] 5.66% | 1,838 | 52.0% |
[ 5.5% - 6.0% ] 5.74% | 244 | 50.9% |
[ 5.5% - 6.0% ] 5.93% | 118 | 33.1% |
[ 6.0% - 6.5% ] 6.47% | 1,113 | 71.5% |
[ 7.5% - 8.0% ] 7.60% | 171 | 46.1% |
[ 7.5% - 8.0% ] 7.84% | 370 | 68.4% |
[ 8.0% - 8.5% ] 8.11% | 74 | 37.5% |