Estonian Disability
COMPARE
Estonian
Select to Compare
Disability
Estonian Disability
11.7%
DISABILITY
54.4/ 100
METRIC RATING
167th/ 347
METRIC RANK
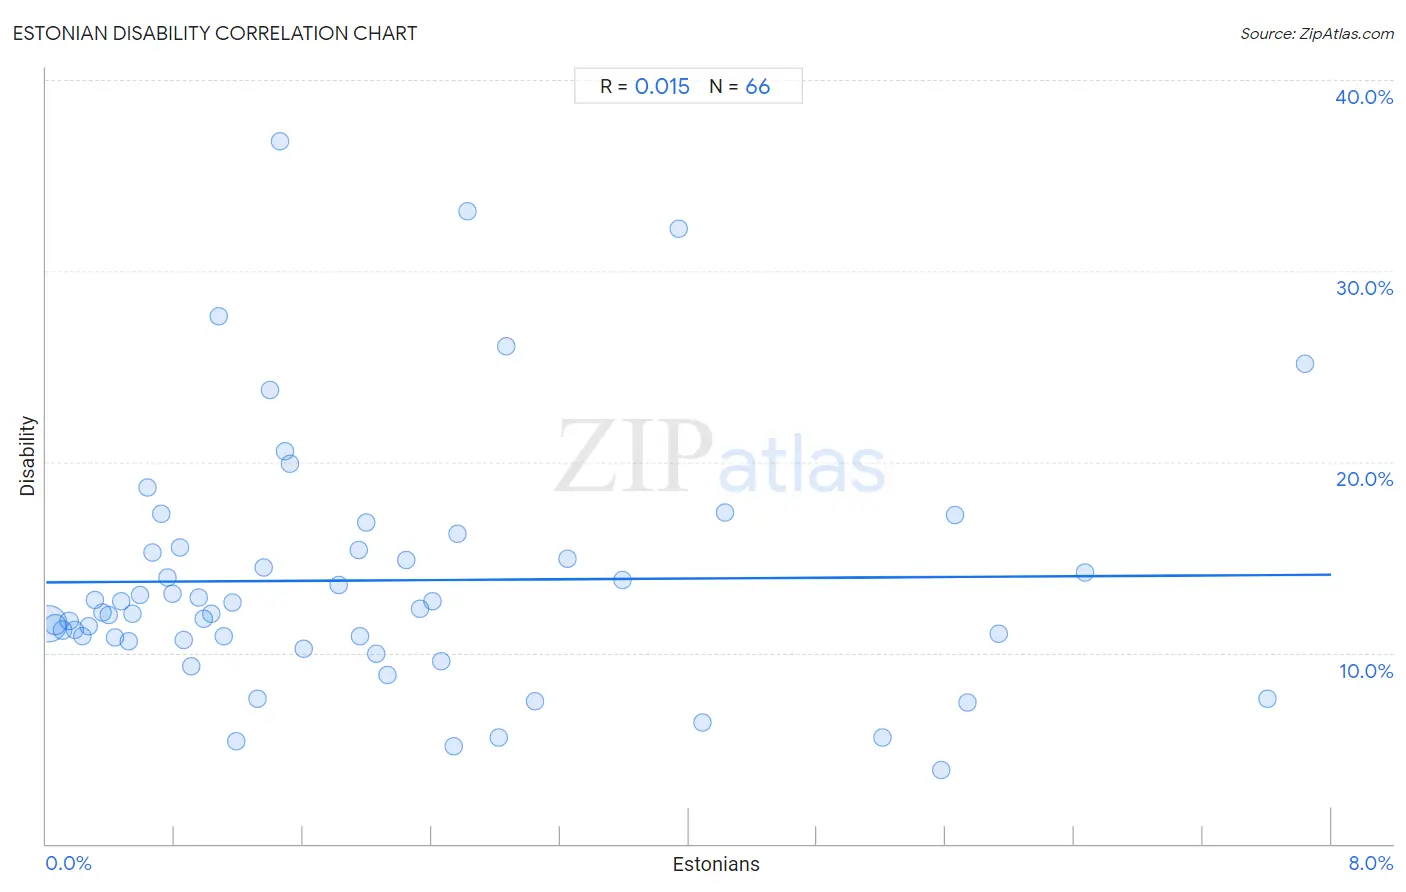
Estonian Disability Correlation Chart
The statistical analysis conducted on geographies consisting of 123,527,631 people shows no correlation between the proportion of Estonians and percentage of population with a disability in the United States with a correlation coefficient (R) of 0.015 and weighted average of 11.7%. On average, for every 1% (one percent) increase in Estonians within a typical geography, there is an increase of 0.050% in percentage of population with a disability.
It is essential to understand that the correlation between the percentage of Estonians and percentage of population with a disability does not imply a direct cause-and-effect relationship. It remains uncertain whether the presence of Estonians influences an upward or downward trend in the level of percentage of population with a disability within an area, or if Estonians simply ended up residing in those areas with higher or lower levels of percentage of population with a disability due to other factors.
Demographics Similar to Estonians by Disability
In terms of disability, the demographic groups most similar to Estonians are Pakistani (11.7%, a difference of 0.010%), Immigrants from Latin America (11.7%, a difference of 0.020%), Immigrants from Austria (11.7%, a difference of 0.050%), Immigrants from Albania (11.7%, a difference of 0.070%), and Immigrants from Southern Europe (11.7%, a difference of 0.070%).
| Demographics | Rating | Rank | Disability |
| Immigrants from Barbados | 64.2 /100 | #160 | Good 11.6% |
| Immigrants from Cuba | 62.8 /100 | #161 | Good 11.6% |
| Immigrants from Haiti | 59.2 /100 | #162 | Average 11.7% |
| Immigrants from Trinidad and Tobago | 58.9 /100 | #163 | Average 11.7% |
| Syrians | 58.5 /100 | #164 | Average 11.7% |
| Cubans | 56.7 /100 | #165 | Average 11.7% |
| Pakistanis | 54.7 /100 | #166 | Average 11.7% |
| Estonians | 54.4 /100 | #167 | Average 11.7% |
| Immigrants from Latin America | 54.1 /100 | #168 | Average 11.7% |
| Immigrants from Austria | 53.4 /100 | #169 | Average 11.7% |
| Immigrants from Albania | 52.8 /100 | #170 | Average 11.7% |
| Immigrants from Southern Europe | 52.8 /100 | #171 | Average 11.7% |
| Trinidadians and Tobagonians | 52.7 /100 | #172 | Average 11.7% |
| Maltese | 50.6 /100 | #173 | Average 11.7% |
| Albanians | 50.0 /100 | #174 | Average 11.7% |
Estonian Disability Correlation Summary
| Measurement | Estonian Data | Disability Data |
| Minimum | 0.014% | 3.8% |
| Maximum | 7.8% | 36.8% |
| Range | 7.8% | 33.0% |
| Mean | 2.0% | 13.8% |
| Median | 1.4% | 12.2% |
| Interquartile 25% (IQ1) | 0.66% | 10.7% |
| Interquartile 75% (IQ3) | 2.6% | 15.4% |
| Interquartile Range (IQR) | 2.0% | 4.8% |
| Standard Deviation (Sample) | 1.9% | 6.6% |
| Standard Deviation (Population) | 1.9% | 6.5% |
Correlation Details
| Estonian Percentile | Sample Size | Disability |
[ 0.0% - 0.5% ] 0.014% | 93,128,970 | 11.5% |
[ 0.0% - 0.5% ] 0.057% | 16,418,534 | 11.5% |
[ 0.0% - 0.5% ] 0.099% | 5,986,610 | 11.2% |
[ 0.0% - 0.5% ] 0.14% | 3,140,364 | 11.7% |
[ 0.0% - 0.5% ] 0.18% | 1,327,187 | 11.2% |
[ 0.0% - 0.5% ] 0.22% | 1,026,788 | 10.9% |
[ 0.0% - 0.5% ] 0.26% | 594,166 | 11.4% |
[ 0.0% - 0.5% ] 0.30% | 432,457 | 12.8% |
[ 0.0% - 0.5% ] 0.35% | 151,838 | 12.1% |
[ 0.0% - 0.5% ] 0.39% | 284,971 | 12.0% |
[ 0.0% - 0.5% ] 0.43% | 154,819 | 10.8% |
[ 0.0% - 0.5% ] 0.46% | 167,368 | 12.7% |
[ 0.5% - 1.0% ] 0.51% | 93,892 | 10.6% |
[ 0.5% - 1.0% ] 0.54% | 103,770 | 12.0% |
[ 0.5% - 1.0% ] 0.59% | 53,292 | 13.0% |
[ 0.5% - 1.0% ] 0.63% | 60,767 | 18.6% |
[ 0.5% - 1.0% ] 0.66% | 56,901 | 15.3% |
[ 0.5% - 1.0% ] 0.72% | 16,922 | 17.3% |
[ 0.5% - 1.0% ] 0.76% | 23,575 | 14.0% |
[ 0.5% - 1.0% ] 0.79% | 22,279 | 13.1% |
[ 0.5% - 1.0% ] 0.83% | 5,406 | 15.5% |
[ 0.5% - 1.0% ] 0.86% | 76,168 | 10.7% |
[ 0.5% - 1.0% ] 0.90% | 16,440 | 9.3% |
[ 0.5% - 1.0% ] 0.95% | 16,636 | 12.9% |
[ 0.5% - 1.0% ] 0.98% | 4,913 | 11.8% |
[ 1.0% - 1.5% ] 1.03% | 1,364 | 12.1% |
[ 1.0% - 1.5% ] 1.08% | 837 | 27.6% |
[ 1.0% - 1.5% ] 1.11% | 22,519 | 10.8% |
[ 1.0% - 1.5% ] 1.16% | 8,012 | 12.7% |
[ 1.0% - 1.5% ] 1.18% | 5,067 | 5.4% |
[ 1.0% - 1.5% ] 1.31% | 15,542 | 7.6% |
[ 1.0% - 1.5% ] 1.35% | 10,131 | 14.4% |
[ 1.0% - 1.5% ] 1.40% | 5,730 | 23.8% |
[ 1.0% - 1.5% ] 1.46% | 1,304 | 36.8% |
[ 1.0% - 1.5% ] 1.49% | 4,371 | 20.6% |
[ 1.5% - 2.0% ] 1.51% | 3,500 | 19.9% |
[ 1.5% - 2.0% ] 1.61% | 13,080 | 10.2% |
[ 1.5% - 2.0% ] 1.82% | 8,851 | 13.5% |
[ 1.5% - 2.0% ] 1.94% | 1,493 | 15.4% |
[ 1.5% - 2.0% ] 1.95% | 7,417 | 10.9% |
[ 1.5% - 2.0% ] 1.99% | 8,430 | 16.8% |
[ 2.0% - 2.5% ] 2.05% | 15,599 | 9.9% |
[ 2.0% - 2.5% ] 2.13% | 564 | 8.9% |
[ 2.0% - 2.5% ] 2.24% | 1,294 | 14.8% |
[ 2.0% - 2.5% ] 2.33% | 472 | 12.3% |
[ 2.0% - 2.5% ] 2.40% | 874 | 12.7% |
[ 2.0% - 2.5% ] 2.46% | 1,300 | 9.5% |
[ 2.5% - 3.0% ] 2.54% | 3,822 | 5.1% |
[ 2.5% - 3.0% ] 2.56% | 3,043 | 16.3% |
[ 2.5% - 3.0% ] 2.62% | 1,145 | 33.1% |
[ 2.5% - 3.0% ] 2.82% | 3,441 | 5.5% |
[ 2.5% - 3.0% ] 2.86% | 1,362 | 26.1% |
[ 3.0% - 3.5% ] 3.04% | 1,544 | 7.4% |
[ 3.0% - 3.5% ] 3.25% | 154 | 14.9% |
[ 3.5% - 4.0% ] 3.59% | 2,286 | 13.8% |
[ 3.5% - 4.0% ] 3.94% | 1,067 | 32.2% |
[ 4.0% - 4.5% ] 4.08% | 1,567 | 6.3% |
[ 4.0% - 4.5% ] 4.23% | 213 | 17.4% |
[ 5.0% - 5.5% ] 5.21% | 595 | 5.5% |
[ 5.5% - 6.0% ] 5.57% | 754 | 3.8% |
[ 5.5% - 6.0% ] 5.66% | 1,838 | 17.2% |
[ 5.5% - 6.0% ] 5.74% | 244 | 7.4% |
[ 5.5% - 6.0% ] 5.93% | 118 | 11.0% |
[ 6.0% - 6.5% ] 6.47% | 1,113 | 14.2% |
[ 7.5% - 8.0% ] 7.60% | 171 | 7.6% |
[ 7.5% - 8.0% ] 7.84% | 370 | 25.1% |