Argentinean vs Spanish American Indian 4 or more Vehicles in Household
COMPARE
Argentinean
Spanish American Indian
4 or more Vehicles in Household
4 or more Vehicles in Household Comparison
Argentineans
Spanish American Indians
6.2%
4 OR MORE VEHICLES IN HOUSEHOLD
27.0/ 100
METRIC RATING
195th/ 347
METRIC RANK
10.8%
4 OR MORE VEHICLES IN HOUSEHOLD
100.0/ 100
METRIC RATING
3rd/ 347
METRIC RANK
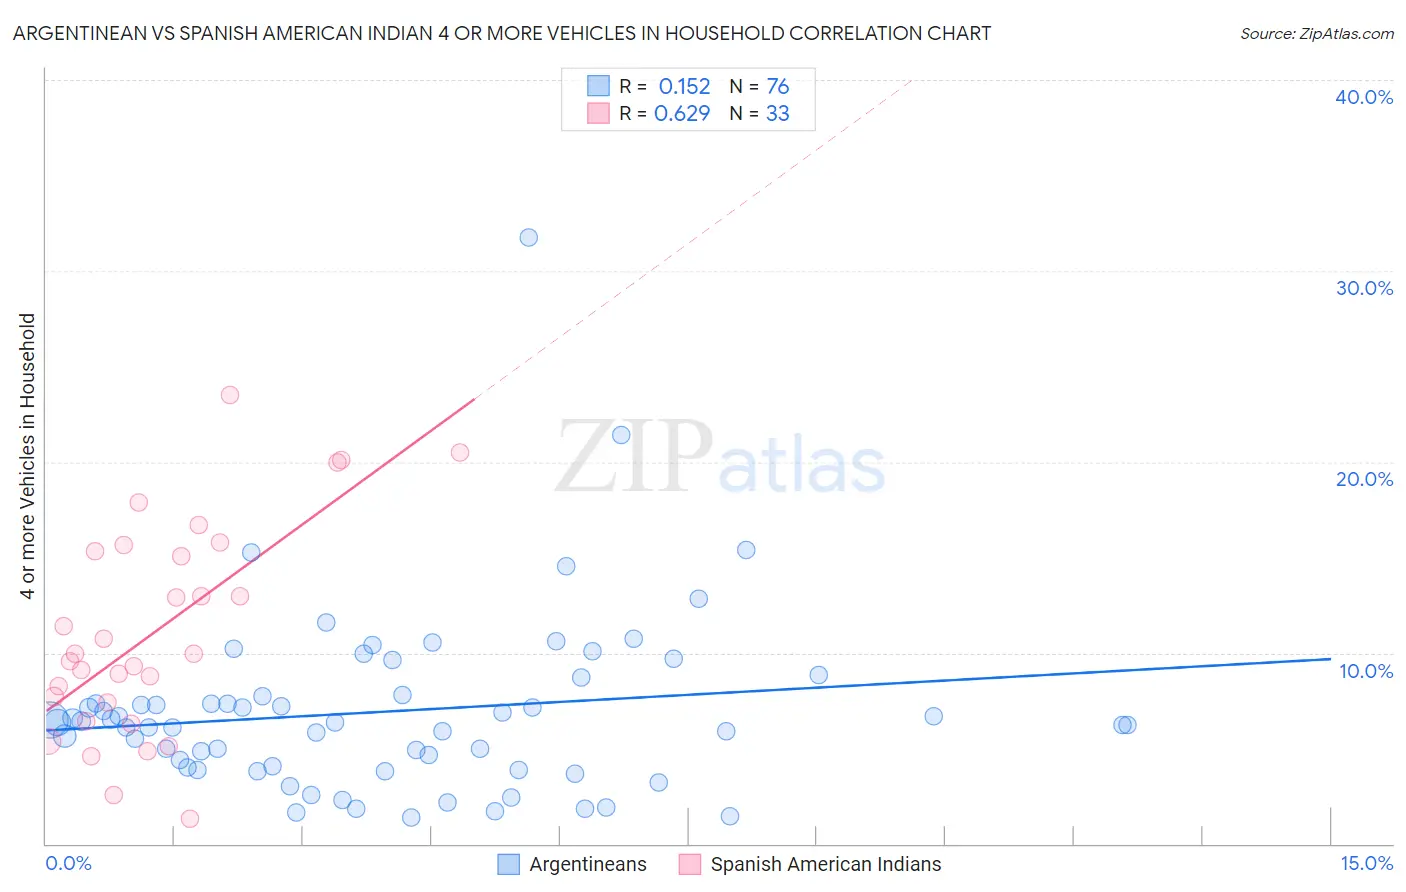
Argentinean vs Spanish American Indian 4 or more Vehicles in Household Correlation Chart
The statistical analysis conducted on geographies consisting of 295,773,782 people shows a poor positive correlation between the proportion of Argentineans and percentage of households with 4 or more vehicles available in the United States with a correlation coefficient (R) of 0.152 and weighted average of 6.2%. Similarly, the statistical analysis conducted on geographies consisting of 73,144,698 people shows a significant positive correlation between the proportion of Spanish American Indians and percentage of households with 4 or more vehicles available in the United States with a correlation coefficient (R) of 0.629 and weighted average of 10.8%, a difference of 74.7%.
4 or more Vehicles in Household Correlation Summary
| Measurement | Argentinean | Spanish American Indian |
| Minimum | 1.3% | 1.3% |
| Maximum | 31.8% | 23.5% |
| Range | 30.4% | 22.2% |
| Mean | 6.9% | 11.1% |
| Median | 6.3% | 9.9% |
| Interquartile 25% (IQ1) | 4.0% | 6.9% |
| Interquartile 75% (IQ3) | 7.8% | 15.5% |
| Interquartile Range (IQR) | 3.7% | 8.6% |
| Standard Deviation (Sample) | 4.6% | 5.5% |
| Standard Deviation (Population) | 4.6% | 5.5% |
Similar Demographics by 4 or more Vehicles in Household
Demographics Similar to Argentineans by 4 or more Vehicles in Household
In terms of 4 or more vehicles in household, the demographic groups most similar to Argentineans are Immigrants from Sweden (6.2%, a difference of 0.0%), Tsimshian (6.2%, a difference of 0.070%), Immigrants from Kuwait (6.2%, a difference of 0.13%), Immigrants from Sri Lanka (6.1%, a difference of 0.45%), and Romanian (6.2%, a difference of 0.47%).
| Demographics | Rating | Rank | 4 or more Vehicles in Household |
| Kiowa | 34.7 /100 | #188 | Fair 6.2% |
| Immigrants | Eastern Asia | 33.3 /100 | #189 | Fair 6.2% |
| South Africans | 32.2 /100 | #190 | Fair 6.2% |
| Inupiat | 30.7 /100 | #191 | Fair 6.2% |
| Romanians | 30.7 /100 | #192 | Fair 6.2% |
| Immigrants | Kuwait | 28.0 /100 | #193 | Fair 6.2% |
| Immigrants | Sweden | 27.0 /100 | #194 | Fair 6.2% |
| Argentineans | 27.0 /100 | #195 | Fair 6.2% |
| Tsimshian | 26.4 /100 | #196 | Fair 6.2% |
| Immigrants | Sri Lanka | 23.7 /100 | #197 | Fair 6.1% |
| Immigrants | Portugal | 22.3 /100 | #198 | Fair 6.1% |
| Immigrants | Norway | 21.8 /100 | #199 | Fair 6.1% |
| Latvians | 21.7 /100 | #200 | Fair 6.1% |
| Egyptians | 21.4 /100 | #201 | Fair 6.1% |
| Immigrants | South Central Asia | 21.3 /100 | #202 | Fair 6.1% |
Demographics Similar to Spanish American Indians by 4 or more Vehicles in Household
In terms of 4 or more vehicles in household, the demographic groups most similar to Spanish American Indians are Colville (11.1%, a difference of 3.5%), Tongan (10.0%, a difference of 7.3%), Immigrants from Fiji (9.6%, a difference of 11.9%), Puget Sound Salish (9.4%, a difference of 14.7%), and Native Hawaiian (9.4%, a difference of 14.7%).
| Demographics | Rating | Rank | 4 or more Vehicles in Household |
| Yakama | 100 /100 | #1 | Exceptional 12.9% |
| Colville | 100.0 /100 | #2 | Exceptional 11.1% |
| Spanish American Indians | 100.0 /100 | #3 | Exceptional 10.8% |
| Tongans | 100.0 /100 | #4 | Exceptional 10.0% |
| Immigrants | Fiji | 100.0 /100 | #5 | Exceptional 9.6% |
| Puget Sound Salish | 100.0 /100 | #6 | Exceptional 9.4% |
| Native Hawaiians | 100.0 /100 | #7 | Exceptional 9.4% |
| Arapaho | 100.0 /100 | #8 | Exceptional 9.4% |
| Samoans | 100.0 /100 | #9 | Exceptional 9.2% |
| Paiute | 100.0 /100 | #10 | Exceptional 9.0% |
| Immigrants | Mexico | 100.0 /100 | #11 | Exceptional 9.0% |
| Mexicans | 100.0 /100 | #12 | Exceptional 8.9% |
| Hawaiians | 100.0 /100 | #13 | Exceptional 8.9% |
| Chinese | 100.0 /100 | #14 | Exceptional 8.8% |
| Shoshone | 100.0 /100 | #15 | Exceptional 8.8% |