Immigrants from Eastern Europe 3 or more Vehicles in Household
COMPARE
Immigrants from Eastern Europe
Select to Compare
3 or more Vehicles in Household
Immigrants from Eastern Europe 3 or more Vehicles in Household
17.4%
3+ VEHICLES AVAILABLE
0.3/ 100
METRIC RATING
280th/ 347
METRIC RANK
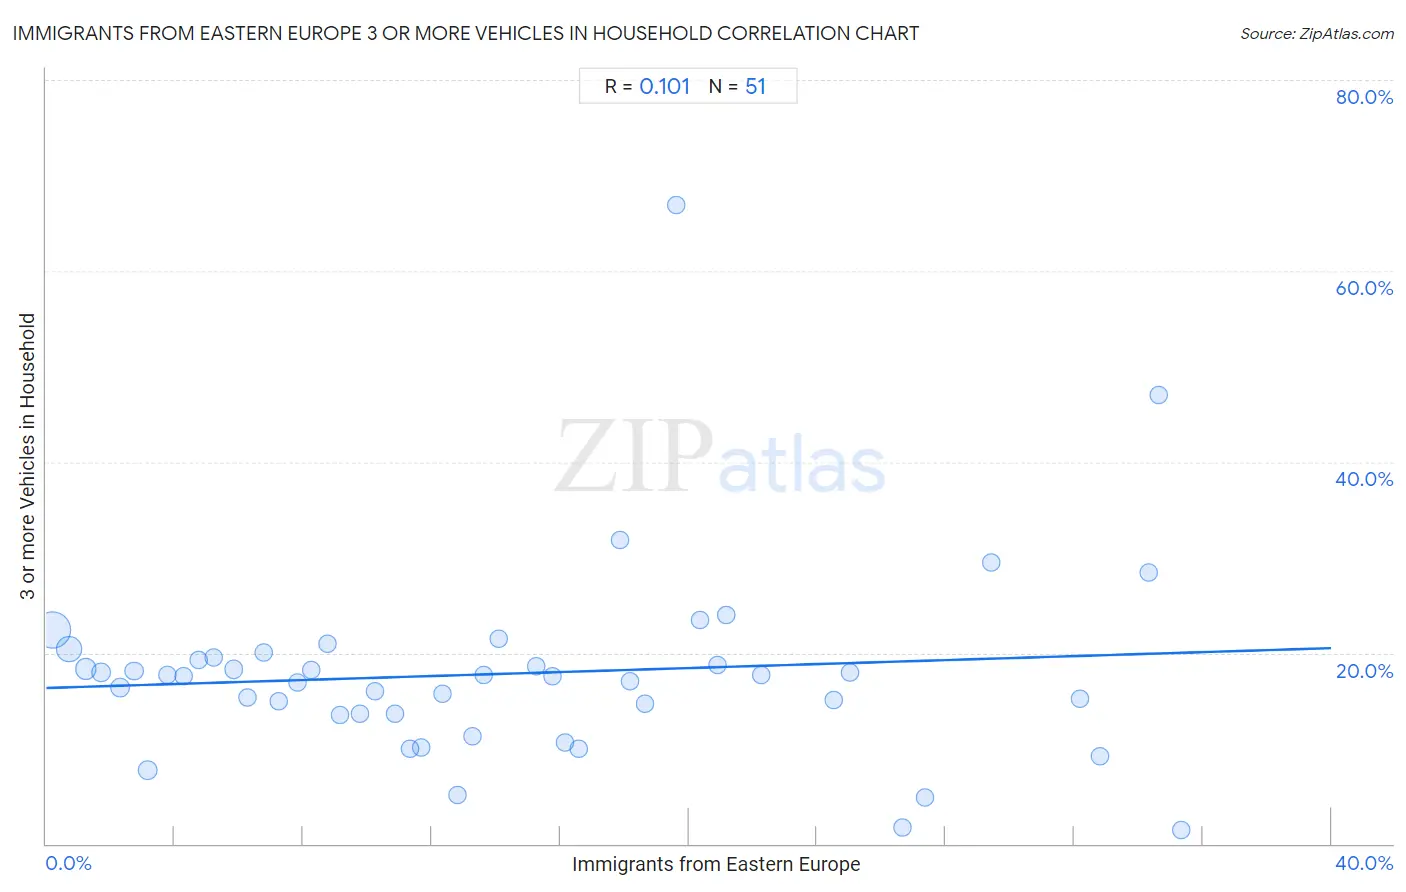
Immigrants from Eastern Europe 3 or more Vehicles in Household Correlation Chart
The statistical analysis conducted on geographies consisting of 475,306,541 people shows a poor positive correlation between the proportion of Immigrants from Eastern Europe and percentage of households with 3 or more vehicles available in the United States with a correlation coefficient (R) of 0.101 and weighted average of 17.4%. On average, for every 1% (one percent) increase in Immigrants from Eastern Europe within a typical geography, there is an increase of 0.10% in percentage of households with 3 or more vehicles available.
It is essential to understand that the correlation between the percentage of Immigrants from Eastern Europe and percentage of households with 3 or more vehicles available does not imply a direct cause-and-effect relationship. It remains uncertain whether the presence of Immigrants from Eastern Europe influences an upward or downward trend in the level of percentage of households with 3 or more vehicles available within an area, or if Immigrants from Eastern Europe simply ended up residing in those areas with higher or lower levels of percentage of households with 3 or more vehicles available due to other factors.
Demographics Similar to Immigrants from Eastern Europe by 3 or more Vehicles in Household
In terms of 3 or more vehicles in household, the demographic groups most similar to Immigrants from Eastern Europe are Immigrants from Kazakhstan (17.4%, a difference of 0.040%), Immigrants from Latvia (17.4%, a difference of 0.040%), Immigrants from Bahamas (17.4%, a difference of 0.050%), Brazilian (17.4%, a difference of 0.14%), and Okinawan (17.4%, a difference of 0.29%).
| Demographics | Rating | Rank | 3 or more Vehicles in Household |
| Immigrants from Sudan | 0.5 /100 | #273 | Tragic 17.6% |
| Immigrants from Bosnia and Herzegovina | 0.5 /100 | #274 | Tragic 17.5% |
| Immigrants from Ukraine | 0.4 /100 | #275 | Tragic 17.5% |
| Okinawans | 0.4 /100 | #276 | Tragic 17.4% |
| Brazilians | 0.4 /100 | #277 | Tragic 17.4% |
| Immigrants from Bahamas | 0.3 /100 | #278 | Tragic 17.4% |
| Immigrants from Kazakhstan | 0.3 /100 | #279 | Tragic 17.4% |
| Immigrants from Eastern Europe | 0.3 /100 | #280 | Tragic 17.4% |
| Immigrants from Latvia | 0.3 /100 | #281 | Tragic 17.4% |
| Immigrants from Ireland | 0.3 /100 | #282 | Tragic 17.3% |
| Blacks/African Americans | 0.3 /100 | #283 | Tragic 17.3% |
| Immigrants from Colombia | 0.3 /100 | #284 | Tragic 17.3% |
| Immigrants from Croatia | 0.2 /100 | #285 | Tragic 17.2% |
| Menominee | 0.2 /100 | #286 | Tragic 17.2% |
| Immigrants from Brazil | 0.2 /100 | #287 | Tragic 17.1% |
Immigrants from Eastern Europe 3 or more Vehicles in Household Correlation Summary
| Measurement | Immigrants from Eastern Europe Data | 3 or more Vehicles in Household Data |
| Minimum | 0.21% | 1.4% |
| Maximum | 35.3% | 66.9% |
| Range | 35.1% | 65.5% |
| Mean | 14.4% | 17.8% |
| Median | 12.8% | 17.6% |
| Interquartile 25% (IQ1) | 6.3% | 13.6% |
| Interquartile 75% (IQ3) | 20.9% | 19.5% |
| Interquartile Range (IQR) | 14.6% | 5.9% |
| Standard Deviation (Sample) | 9.9% | 10.3% |
| Standard Deviation (Population) | 9.8% | 10.2% |
Correlation Details
| Immigrants from Eastern Europe Percentile | Sample Size | 3 or more Vehicles in Household |
[ 0.0% - 0.5% ] 0.21% | 262,984,073 | 22.4% |
[ 0.5% - 1.0% ] 0.72% | 95,415,483 | 20.4% |
[ 1.0% - 1.5% ] 1.23% | 47,475,402 | 18.3% |
[ 1.5% - 2.0% ] 1.73% | 20,497,473 | 18.0% |
[ 2.0% - 2.5% ] 2.28% | 14,825,040 | 16.4% |
[ 2.5% - 3.0% ] 2.74% | 6,883,860 | 18.1% |
[ 3.0% - 3.5% ] 3.16% | 12,426,273 | 7.7% |
[ 3.5% - 4.0% ] 3.76% | 3,428,363 | 17.7% |
[ 4.0% - 4.5% ] 4.27% | 2,645,594 | 17.6% |
[ 4.5% - 5.0% ] 4.74% | 1,649,482 | 19.3% |
[ 5.0% - 5.5% ] 5.20% | 1,069,674 | 19.5% |
[ 5.5% - 6.0% ] 5.82% | 781,224 | 18.3% |
[ 6.0% - 6.5% ] 6.26% | 794,965 | 15.3% |
[ 6.5% - 7.0% ] 6.76% | 451,060 | 20.1% |
[ 7.0% - 7.5% ] 7.23% | 407,964 | 14.9% |
[ 7.5% - 8.0% ] 7.81% | 380,182 | 16.9% |
[ 8.0% - 8.5% ] 8.24% | 374,212 | 18.2% |
[ 8.5% - 9.0% ] 8.75% | 33,254 | 20.9% |
[ 9.0% - 9.5% ] 9.15% | 257,708 | 13.5% |
[ 9.5% - 10.0% ] 9.76% | 248,224 | 13.6% |
[ 10.0% - 10.5% ] 10.24% | 354,466 | 15.9% |
[ 10.5% - 11.0% ] 10.86% | 411,462 | 13.7% |
[ 11.0% - 11.5% ] 11.32% | 137,967 | 9.9% |
[ 11.5% - 12.0% ] 11.66% | 164,262 | 10.1% |
[ 12.0% - 12.5% ] 12.35% | 235,236 | 15.8% |
[ 12.5% - 13.0% ] 12.81% | 109,026 | 5.2% |
[ 13.0% - 13.5% ] 13.25% | 79,100 | 11.3% |
[ 13.5% - 14.0% ] 13.63% | 204,296 | 17.7% |
[ 14.0% - 14.5% ] 14.08% | 44,527 | 21.5% |
[ 15.0% - 15.5% ] 15.26% | 21,064 | 18.6% |
[ 15.5% - 16.0% ] 15.75% | 29,743 | 17.5% |
[ 16.0% - 16.5% ] 16.13% | 153,689 | 10.6% |
[ 16.5% - 17.0% ] 16.59% | 820 | 9.9% |
[ 17.5% - 18.0% ] 17.86% | 84 | 31.8% |
[ 18.0% - 18.5% ] 18.18% | 65,901 | 17.1% |
[ 18.5% - 19.0% ] 18.64% | 30,080 | 14.6% |
[ 19.5% - 20.0% ] 19.61% | 357 | 66.9% |
[ 20.0% - 20.5% ] 20.33% | 1,864 | 23.5% |
[ 20.5% - 21.0% ] 20.89% | 15,393 | 18.7% |
[ 21.0% - 21.5% ] 21.18% | 1,539 | 24.0% |
[ 22.0% - 22.5% ] 22.24% | 26,408 | 17.6% |
[ 24.5% - 25.0% ] 24.50% | 8,942 | 15.0% |
[ 25.0% - 25.5% ] 25.01% | 23,200 | 18.0% |
[ 26.5% - 27.0% ] 26.66% | 47,893 | 1.8% |
[ 27.0% - 27.5% ] 27.36% | 402 | 4.9% |
[ 29.0% - 29.5% ] 29.41% | 238 | 29.4% |
[ 32.0% - 32.5% ] 32.17% | 2,027 | 15.2% |
[ 32.5% - 33.0% ] 32.78% | 23,676 | 9.2% |
[ 34.0% - 34.5% ] 34.31% | 274 | 28.4% |
[ 34.5% - 35.0% ] 34.62% | 26 | 47.1% |
[ 35.0% - 35.5% ] 35.35% | 83,069 | 1.4% |