Immigrants from Eastern Europe Married-couple Households
COMPARE
Immigrants from Eastern Europe
Select to Compare
Married-couple Households
Immigrants from Eastern Europe Married-couple Households
47.4%
MARRIED-COUPLE HOUSEHOLDS
90.3/ 100
METRIC RATING
121st/ 347
METRIC RANK
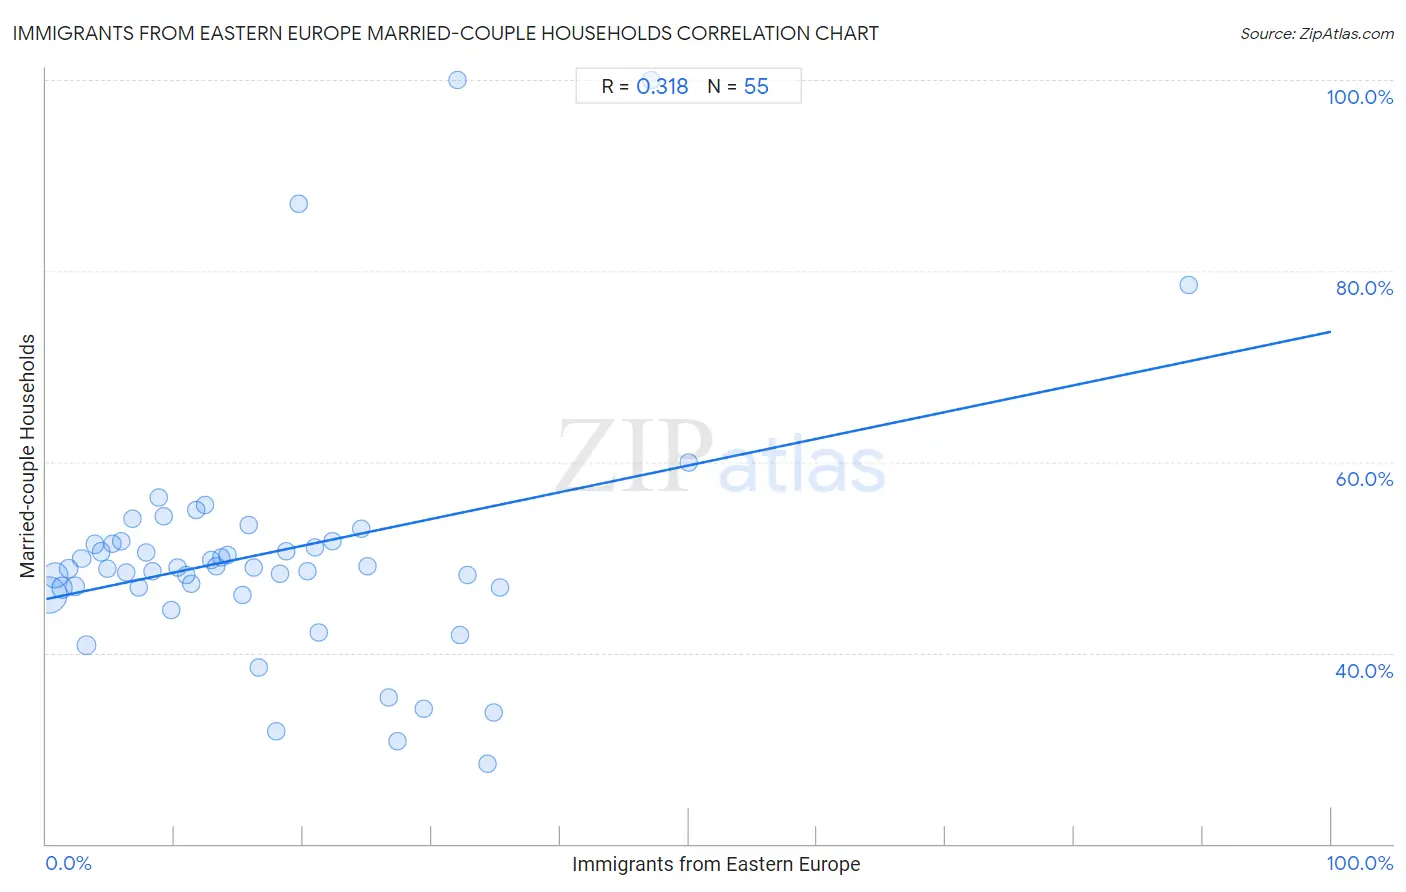
Immigrants from Eastern Europe Married-couple Households Correlation Chart
The statistical analysis conducted on geographies consisting of 475,489,582 people shows a mild positive correlation between the proportion of Immigrants from Eastern Europe and percentage of married-couple family households in the United States with a correlation coefficient (R) of 0.318 and weighted average of 47.4%. On average, for every 1% (one percent) increase in Immigrants from Eastern Europe within a typical geography, there is an increase of 0.28% in percentage of married-couple family households.
It is essential to understand that the correlation between the percentage of Immigrants from Eastern Europe and percentage of married-couple family households does not imply a direct cause-and-effect relationship. It remains uncertain whether the presence of Immigrants from Eastern Europe influences an upward or downward trend in the level of percentage of married-couple family households within an area, or if Immigrants from Eastern Europe simply ended up residing in those areas with higher or lower levels of percentage of married-couple family households due to other factors.
Demographics Similar to Immigrants from Eastern Europe by Married-couple Households
In terms of married-couple households, the demographic groups most similar to Immigrants from Eastern Europe are Puget Sound Salish (47.4%, a difference of 0.020%), Okinawan (47.4%, a difference of 0.020%), Immigrants from Venezuela (47.4%, a difference of 0.10%), Zimbabwean (47.4%, a difference of 0.11%), and Australian (47.4%, a difference of 0.13%).
| Demographics | Rating | Rank | Married-couple Households |
| Immigrants from Europe | 93.7 /100 | #114 | Exceptional 47.6% |
| Slovaks | 92.9 /100 | #115 | Exceptional 47.6% |
| Argentineans | 92.5 /100 | #116 | Exceptional 47.5% |
| French Canadians | 92.4 /100 | #117 | Exceptional 47.5% |
| Immigrants from Germany | 92.4 /100 | #118 | Exceptional 47.5% |
| Chileans | 92.2 /100 | #119 | Exceptional 47.5% |
| Puget Sound Salish | 90.5 /100 | #120 | Exceptional 47.4% |
| Immigrants from Eastern Europe | 90.3 /100 | #121 | Exceptional 47.4% |
| Okinawans | 90.1 /100 | #122 | Exceptional 47.4% |
| Immigrants from Venezuela | 89.3 /100 | #123 | Excellent 47.4% |
| Zimbabweans | 89.2 /100 | #124 | Excellent 47.4% |
| Australians | 89.0 /100 | #125 | Excellent 47.4% |
| Pakistanis | 88.6 /100 | #126 | Excellent 47.3% |
| Celtics | 88.1 /100 | #127 | Excellent 47.3% |
| Immigrants from Peru | 87.9 /100 | #128 | Excellent 47.3% |
Immigrants from Eastern Europe Married-couple Households Correlation Summary
| Measurement | Immigrants from Eastern Europe Data | Married-couple Households Data |
| Minimum | 0.21% | 28.4% |
| Maximum | 88.9% | 100.0% |
| Range | 88.7% | 71.6% |
| Mean | 17.3% | 50.5% |
| Median | 13.6% | 49.0% |
| Interquartile 25% (IQ1) | 6.8% | 46.8% |
| Interquartile 75% (IQ3) | 24.5% | 51.7% |
| Interquartile Range (IQR) | 17.7% | 4.9% |
| Standard Deviation (Sample) | 15.3% | 13.5% |
| Standard Deviation (Population) | 15.2% | 13.4% |
Correlation Details
| Immigrants from Eastern Europe Percentile | Sample Size | Married-couple Households |
[ 0.0% - 0.5% ] 0.21% | 263,033,823 | 46.0% |
[ 0.5% - 1.0% ] 0.72% | 95,433,146 | 48.1% |
[ 1.0% - 1.5% ] 1.23% | 47,495,347 | 46.8% |
[ 1.5% - 2.0% ] 1.72% | 20,509,134 | 48.8% |
[ 2.0% - 2.5% ] 2.28% | 14,830,735 | 46.9% |
[ 2.5% - 3.0% ] 2.74% | 6,901,505 | 49.9% |
[ 3.0% - 3.5% ] 3.16% | 12,436,122 | 40.8% |
[ 3.5% - 4.0% ] 3.76% | 3,440,793 | 51.4% |
[ 4.0% - 4.5% ] 4.27% | 2,654,898 | 50.6% |
[ 4.5% - 5.0% ] 4.74% | 1,668,732 | 48.8% |
[ 5.0% - 5.5% ] 5.20% | 1,074,776 | 51.4% |
[ 5.5% - 6.0% ] 5.82% | 781,224 | 51.7% |
[ 6.0% - 6.5% ] 6.26% | 794,965 | 48.4% |
[ 6.5% - 7.0% ] 6.76% | 451,319 | 54.1% |
[ 7.0% - 7.5% ] 7.23% | 407,964 | 46.8% |
[ 7.5% - 8.0% ] 7.81% | 380,182 | 50.6% |
[ 8.0% - 8.5% ] 8.24% | 374,224 | 48.6% |
[ 8.5% - 9.0% ] 8.75% | 33,254 | 56.2% |
[ 9.0% - 9.5% ] 9.15% | 257,708 | 54.3% |
[ 9.5% - 10.0% ] 9.76% | 248,224 | 44.4% |
[ 10.0% - 10.5% ] 10.24% | 354,466 | 49.0% |
[ 10.5% - 11.0% ] 10.86% | 411,462 | 48.2% |
[ 11.0% - 11.5% ] 11.32% | 138,119 | 47.2% |
[ 11.5% - 12.0% ] 11.66% | 164,262 | 55.0% |
[ 12.0% - 12.5% ] 12.35% | 235,236 | 55.5% |
[ 12.5% - 13.0% ] 12.81% | 109,026 | 49.7% |
[ 13.0% - 13.5% ] 13.25% | 79,100 | 49.1% |
[ 13.5% - 14.0% ] 13.63% | 204,296 | 50.0% |
[ 14.0% - 14.5% ] 14.08% | 46,399 | 50.3% |
[ 15.0% - 15.5% ] 15.27% | 22,886 | 46.1% |
[ 15.5% - 16.0% ] 15.75% | 29,743 | 53.4% |
[ 16.0% - 16.5% ] 16.13% | 153,689 | 49.0% |
[ 16.5% - 17.0% ] 16.59% | 820 | 38.5% |
[ 17.5% - 18.0% ] 17.86% | 84 | 31.8% |
[ 18.0% - 18.5% ] 18.18% | 66,175 | 48.3% |
[ 18.5% - 19.0% ] 18.64% | 30,080 | 50.7% |
[ 19.5% - 20.0% ] 19.61% | 357 | 87.1% |
[ 20.0% - 20.5% ] 20.33% | 1,864 | 48.6% |
[ 20.5% - 21.0% ] 20.89% | 15,432 | 51.1% |
[ 21.0% - 21.5% ] 21.18% | 1,539 | 42.1% |
[ 22.0% - 22.5% ] 22.24% | 26,408 | 51.7% |
[ 24.5% - 25.0% ] 24.50% | 8,942 | 53.0% |
[ 25.0% - 25.5% ] 25.01% | 23,200 | 49.1% |
[ 26.5% - 27.0% ] 26.66% | 47,893 | 35.3% |
[ 27.0% - 27.5% ] 27.36% | 402 | 30.7% |
[ 29.0% - 29.5% ] 29.41% | 238 | 34.1% |
[ 32.0% - 32.5% ] 32.00% | 25 | 100.0% |
[ 32.0% - 32.5% ] 32.17% | 2,027 | 41.9% |
[ 32.5% - 33.0% ] 32.78% | 23,676 | 48.1% |
[ 34.0% - 34.5% ] 34.31% | 274 | 28.4% |
[ 34.5% - 35.0% ] 34.81% | 181 | 33.7% |
[ 35.0% - 35.5% ] 35.35% | 83,069 | 46.8% |
[ 47.0% - 47.5% ] 47.06% | 68 | 100.0% |
[ 50.0% - 50.5% ] 50.00% | 42 | 60.0% |
[ 88.5% - 89.0% ] 88.89% | 27 | 78.6% |