Immigrants from Eastern Europe 1 or more Vehicles in Household
COMPARE
Immigrants from Eastern Europe
Select to Compare
1 or more Vehicles in Household
Immigrants from Eastern Europe 1 or more Vehicles in Household
86.7%
1+ VEHICLES AVAILABLE
0.0/ 100
METRIC RATING
283rd/ 347
METRIC RANK
Immigrants from Eastern Europe 1 or more Vehicles in Household Correlation Chart
The statistical analysis conducted on geographies consisting of 475,429,921 people shows a moderate positive correlation between the proportion of Immigrants from Eastern Europe and percentage of households with 1 or more vehicles available in the United States with a correlation coefficient (R) of 0.433 and weighted average of 86.7%. On average, for every 1% (one percent) increase in Immigrants from Eastern Europe within a typical geography, there is an increase of 0.22% in percentage of households with 1 or more vehicles available.
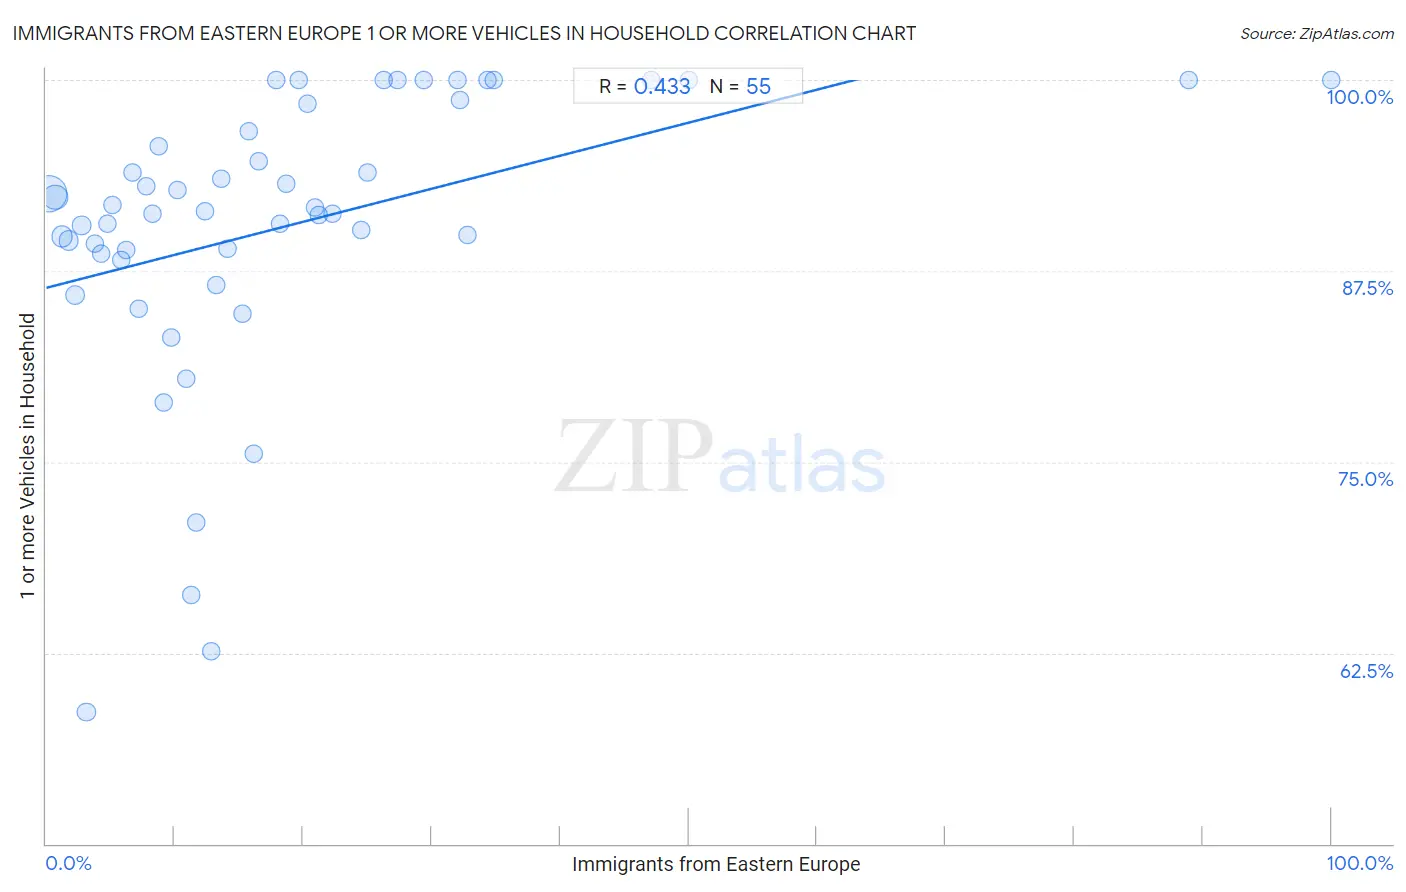
It is essential to understand that the correlation between the percentage of Immigrants from Eastern Europe and percentage of households with 1 or more vehicles available does not imply a direct cause-and-effect relationship. It remains uncertain whether the presence of Immigrants from Eastern Europe influences an upward or downward trend in the level of percentage of households with 1 or more vehicles available within an area, or if Immigrants from Eastern Europe simply ended up residing in those areas with higher or lower levels of percentage of households with 1 or more vehicles available due to other factors.
Demographics Similar to Immigrants from Eastern Europe by 1 or more Vehicles in Household
In terms of 1 or more vehicles in household, the demographic groups most similar to Immigrants from Eastern Europe are Central American Indian (86.7%, a difference of 0.0%), Colville (86.8%, a difference of 0.040%), Immigrants from Kazakhstan (86.6%, a difference of 0.21%), Immigrants from Eastern Asia (86.5%, a difference of 0.24%), and Mongolian (87.0%, a difference of 0.27%).
| Demographics | Rating | Rank | 1 or more Vehicles in Household |
| Immigrants from France | 0.1 /100 | #276 | Tragic 87.1% |
| Alsatians | 0.1 /100 | #277 | Tragic 87.1% |
| Immigrants from Southern Europe | 0.1 /100 | #278 | Tragic 87.1% |
| Immigrants from Albania | 0.1 /100 | #279 | Tragic 87.1% |
| Immigrants from Croatia | 0.0 /100 | #280 | Tragic 87.0% |
| Mongolians | 0.0 /100 | #281 | Tragic 87.0% |
| Colville | 0.0 /100 | #282 | Tragic 86.8% |
| Immigrants from Eastern Europe | 0.0 /100 | #283 | Tragic 86.7% |
| Central American Indians | 0.0 /100 | #284 | Tragic 86.7% |
| Immigrants from Kazakhstan | 0.0 /100 | #285 | Tragic 86.6% |
| Immigrants from Eastern Asia | 0.0 /100 | #286 | Tragic 86.5% |
| Immigrants from Malaysia | 0.0 /100 | #287 | Tragic 86.5% |
| Hopi | 0.0 /100 | #288 | Tragic 86.4% |
| Immigrants from Ireland | 0.0 /100 | #289 | Tragic 86.4% |
| Immigrants from Australia | 0.0 /100 | #290 | Tragic 86.4% |
Immigrants from Eastern Europe 1 or more Vehicles in Household Correlation Summary
| Measurement | Immigrants from Eastern Europe Data | 1 or more Vehicles in Household Data |
| Minimum | 0.21% | 58.6% |
| Maximum | 100.0% | 100.0% |
| Range | 99.8% | 41.4% |
| Mean | 18.5% | 90.4% |
| Median | 13.6% | 91.4% |
| Interquartile 25% (IQ1) | 6.8% | 88.6% |
| Interquartile 75% (IQ3) | 24.5% | 98.5% |
| Interquartile Range (IQR) | 17.7% | 9.8% |
| Standard Deviation (Sample) | 18.8% | 9.4% |
| Standard Deviation (Population) | 18.6% | 9.3% |
Correlation Details
| Immigrants from Eastern Europe Percentile | Sample Size | 1 or more Vehicles in Household |
[ 0.0% - 0.5% ] 0.21% | 263,075,807 | 92.5% |
[ 0.5% - 1.0% ] 0.72% | 95,454,613 | 92.3% |
[ 1.0% - 1.5% ] 1.23% | 47,498,649 | 89.7% |
[ 1.5% - 2.0% ] 1.72% | 20,511,640 | 89.5% |
[ 2.0% - 2.5% ] 2.28% | 14,830,735 | 85.9% |
[ 2.5% - 3.0% ] 2.74% | 6,901,584 | 90.5% |
[ 3.0% - 3.5% ] 3.16% | 12,436,344 | 58.6% |
[ 3.5% - 4.0% ] 3.76% | 3,440,793 | 89.3% |
[ 4.0% - 4.5% ] 4.27% | 2,654,898 | 88.6% |
[ 4.5% - 5.0% ] 4.74% | 1,668,732 | 90.6% |
[ 5.0% - 5.5% ] 5.20% | 1,074,947 | 91.8% |
[ 5.5% - 6.0% ] 5.82% | 781,770 | 88.2% |
[ 6.0% - 6.5% ] 6.26% | 794,965 | 88.9% |
[ 6.5% - 7.0% ] 6.76% | 451,319 | 93.9% |
[ 7.0% - 7.5% ] 7.23% | 407,964 | 85.1% |
[ 7.5% - 8.0% ] 7.81% | 380,972 | 93.1% |
[ 8.0% - 8.5% ] 8.24% | 374,224 | 91.2% |
[ 8.5% - 9.0% ] 8.75% | 33,254 | 95.7% |
[ 9.0% - 9.5% ] 9.15% | 257,708 | 78.9% |
[ 9.5% - 10.0% ] 9.76% | 248,224 | 83.2% |
[ 10.0% - 10.5% ] 10.24% | 354,466 | 92.8% |
[ 10.5% - 11.0% ] 10.86% | 411,462 | 80.4% |
[ 11.0% - 11.5% ] 11.32% | 138,119 | 66.3% |
[ 11.5% - 12.0% ] 11.66% | 164,262 | 71.0% |
[ 12.0% - 12.5% ] 12.35% | 235,236 | 91.4% |
[ 12.5% - 13.0% ] 12.81% | 109,026 | 62.6% |
[ 13.0% - 13.5% ] 13.25% | 79,100 | 86.5% |
[ 13.5% - 14.0% ] 13.63% | 204,296 | 93.5% |
[ 14.0% - 14.5% ] 14.08% | 46,399 | 88.9% |
[ 15.0% - 15.5% ] 15.27% | 22,886 | 84.7% |
[ 15.5% - 16.0% ] 15.75% | 29,743 | 96.7% |
[ 16.0% - 16.5% ] 16.13% | 153,689 | 75.5% |
[ 16.5% - 17.0% ] 16.59% | 820 | 94.7% |
[ 17.5% - 18.0% ] 17.86% | 84 | 100.0% |
[ 18.0% - 18.5% ] 18.18% | 66,175 | 90.6% |
[ 18.5% - 19.0% ] 18.64% | 30,080 | 93.2% |
[ 19.5% - 20.0% ] 19.61% | 357 | 100.0% |
[ 20.0% - 20.5% ] 20.33% | 1,864 | 98.5% |
[ 20.5% - 21.0% ] 20.89% | 15,432 | 91.7% |
[ 21.0% - 21.5% ] 21.18% | 1,539 | 91.2% |
[ 22.0% - 22.5% ] 22.24% | 26,408 | 91.2% |
[ 24.5% - 25.0% ] 24.50% | 8,942 | 90.2% |
[ 25.0% - 25.5% ] 25.01% | 23,200 | 94.0% |
[ 26.0% - 26.5% ] 26.24% | 202 | 100.0% |
[ 27.0% - 27.5% ] 27.36% | 402 | 100.0% |
[ 29.0% - 29.5% ] 29.41% | 238 | 100.0% |
[ 32.0% - 32.5% ] 32.00% | 25 | 100.0% |
[ 32.0% - 32.5% ] 32.17% | 2,027 | 98.7% |
[ 32.5% - 33.0% ] 32.78% | 23,676 | 89.8% |
[ 34.0% - 34.5% ] 34.31% | 274 | 100.0% |
[ 34.5% - 35.0% ] 34.78% | 207 | 100.0% |
[ 47.0% - 47.5% ] 47.06% | 68 | 100.0% |
[ 50.0% - 50.5% ] 50.00% | 42 | 100.0% |
[ 88.5% - 89.0% ] 88.89% | 27 | 100.0% |
[ 99.5% - 100.0% ] 100.00% | 6 | 100.0% |