Immigrants from Eastern Europe Disability Age Under 5
COMPARE
Immigrants from Eastern Europe
Select to Compare
Disability Age Under 5
Immigrants from Eastern Europe Disability Age Under 5
1.2%
DISABILITY | AGE UNDER 5
87.3/ 100
METRIC RATING
132nd/ 347
METRIC RANK
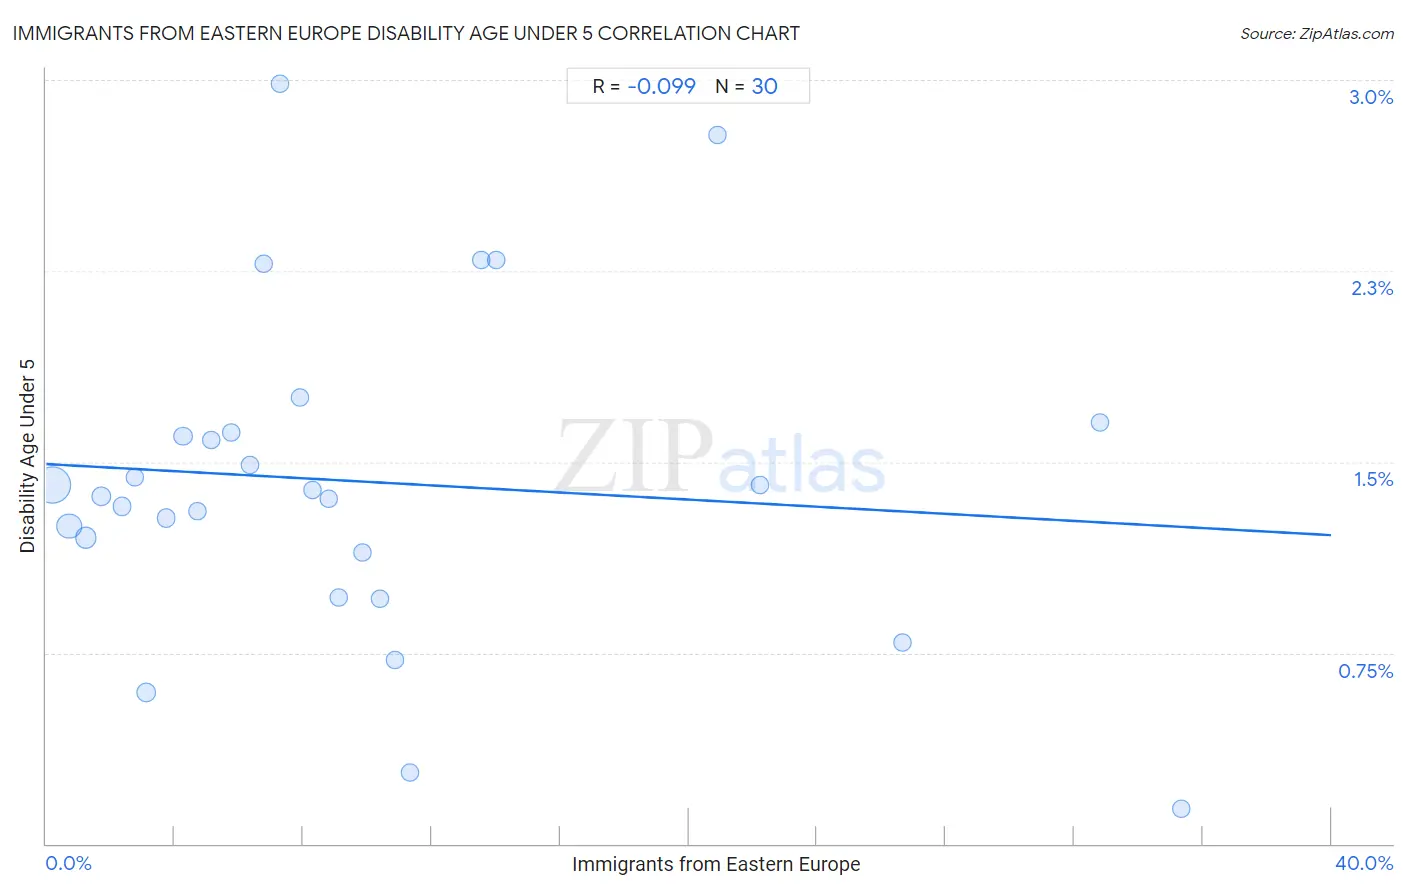
Immigrants from Eastern Europe Disability Age Under 5 Correlation Chart
The statistical analysis conducted on geographies consisting of 238,831,342 people shows a slight negative correlation between the proportion of Immigrants from Eastern Europe and percentage of population with a disability under the age of 5 in the United States with a correlation coefficient (R) of -0.099 and weighted average of 1.2%. On average, for every 1% (one percent) increase in Immigrants from Eastern Europe within a typical geography, there is a decrease of 0.0070% in percentage of population with a disability under the age of 5.
It is essential to understand that the correlation between the percentage of Immigrants from Eastern Europe and percentage of population with a disability under the age of 5 does not imply a direct cause-and-effect relationship. It remains uncertain whether the presence of Immigrants from Eastern Europe influences an upward or downward trend in the level of percentage of population with a disability under the age of 5 within an area, or if Immigrants from Eastern Europe simply ended up residing in those areas with higher or lower levels of percentage of population with a disability under the age of 5 due to other factors.
Demographics Similar to Immigrants from Eastern Europe by Disability Age Under 5
In terms of disability age under 5, the demographic groups most similar to Immigrants from Eastern Europe are Immigrants from Serbia (1.2%, a difference of 0.070%), Korean (1.2%, a difference of 0.090%), Immigrants (1.2%, a difference of 0.16%), Immigrants from Spain (1.2%, a difference of 0.16%), and Immigrants from France (1.2%, a difference of 0.25%).
| Demographics | Rating | Rank | Disability Age Under 5 |
| Japanese | 90.3 /100 | #125 | Exceptional 1.2% |
| Central Americans | 89.7 /100 | #126 | Excellent 1.2% |
| Immigrants from Romania | 88.4 /100 | #127 | Excellent 1.2% |
| Immigrants from France | 88.4 /100 | #128 | Excellent 1.2% |
| Immigrants | 88.0 /100 | #129 | Excellent 1.2% |
| Koreans | 87.7 /100 | #130 | Excellent 1.2% |
| Immigrants from Serbia | 87.6 /100 | #131 | Excellent 1.2% |
| Immigrants from Eastern Europe | 87.3 /100 | #132 | Excellent 1.2% |
| Immigrants from Spain | 86.5 /100 | #133 | Excellent 1.2% |
| Argentineans | 85.7 /100 | #134 | Excellent 1.2% |
| Fijians | 84.7 /100 | #135 | Excellent 1.2% |
| Moroccans | 83.6 /100 | #136 | Excellent 1.2% |
| Immigrants from Eastern Africa | 83.1 /100 | #137 | Excellent 1.2% |
| Immigrants from Czechoslovakia | 82.8 /100 | #138 | Excellent 1.2% |
| New Zealanders | 81.4 /100 | #139 | Excellent 1.2% |
Immigrants from Eastern Europe Disability Age Under 5 Correlation Summary
| Measurement | Immigrants from Eastern Europe Data | Disability Age Under 5 Data |
| Minimum | 0.21% | 0.14% |
| Maximum | 35.3% | 3.0% |
| Range | 35.1% | 2.8% |
| Mean | 9.9% | 1.4% |
| Median | 7.6% | 1.4% |
| Interquartile 25% (IQ1) | 3.8% | 1.1% |
| Interquartile 75% (IQ3) | 11.3% | 1.6% |
| Interquartile Range (IQR) | 7.6% | 0.47% |
| Standard Deviation (Sample) | 9.1% | 0.64% |
| Standard Deviation (Population) | 9.0% | 0.63% |
Correlation Details
| Immigrants from Eastern Europe Percentile | Sample Size | Disability Age Under 5 |
[ 0.0% - 0.5% ] 0.21% | 135,213,577 | 1.4% |
[ 0.5% - 1.0% ] 0.72% | 47,290,896 | 1.2% |
[ 1.0% - 1.5% ] 1.24% | 23,857,591 | 1.2% |
[ 1.5% - 2.0% ] 1.73% | 8,277,673 | 1.4% |
[ 2.0% - 2.5% ] 2.36% | 6,827,359 | 1.3% |
[ 2.5% - 3.0% ] 2.75% | 2,597,125 | 1.4% |
[ 3.0% - 3.5% ] 3.13% | 9,723,101 | 0.60% |
[ 3.5% - 4.0% ] 3.75% | 1,092,606 | 1.3% |
[ 4.0% - 4.5% ] 4.26% | 893,924 | 1.6% |
[ 4.5% - 5.0% ] 4.69% | 805,276 | 1.3% |
[ 5.0% - 5.5% ] 5.14% | 246,227 | 1.6% |
[ 5.5% - 6.0% ] 5.76% | 216,792 | 1.6% |
[ 6.0% - 6.5% ] 6.35% | 274,734 | 1.5% |
[ 6.5% - 7.0% ] 6.77% | 104,478 | 2.3% |
[ 7.0% - 7.5% ] 7.27% | 74,212 | 3.0% |
[ 7.5% - 8.0% ] 7.92% | 173,655 | 1.8% |
[ 8.0% - 8.5% ] 8.29% | 183,937 | 1.4% |
[ 8.5% - 9.0% ] 8.79% | 11,155 | 1.4% |
[ 9.0% - 9.5% ] 9.11% | 166,968 | 0.97% |
[ 9.5% - 10.0% ] 9.83% | 107,317 | 1.1% |
[ 10.0% - 10.5% ] 10.37% | 146,726 | 0.96% |
[ 10.5% - 11.0% ] 10.85% | 184,836 | 0.72% |
[ 11.0% - 11.5% ] 11.33% | 105,521 | 0.28% |
[ 13.5% - 14.0% ] 13.53% | 30,637 | 2.3% |
[ 14.0% - 14.5% ] 14.02% | 30,857 | 2.3% |
[ 20.5% - 21.0% ] 20.89% | 15,291 | 2.8% |
[ 22.0% - 22.5% ] 22.23% | 24,233 | 1.4% |
[ 26.5% - 27.0% ] 26.66% | 47,893 | 0.79% |
[ 32.5% - 33.0% ] 32.78% | 23,676 | 1.7% |
[ 35.0% - 35.5% ] 35.35% | 83,069 | 0.14% |