Peruvian Receiving Food Stamps
COMPARE
Peruvian
Select to Compare
Receiving Food Stamps
Peruvian Receiving Food Stamps
11.7%
PUBLIC INCOME | FOOD STAMPS
49.3/ 100
METRIC RATING
176th/ 347
METRIC RANK
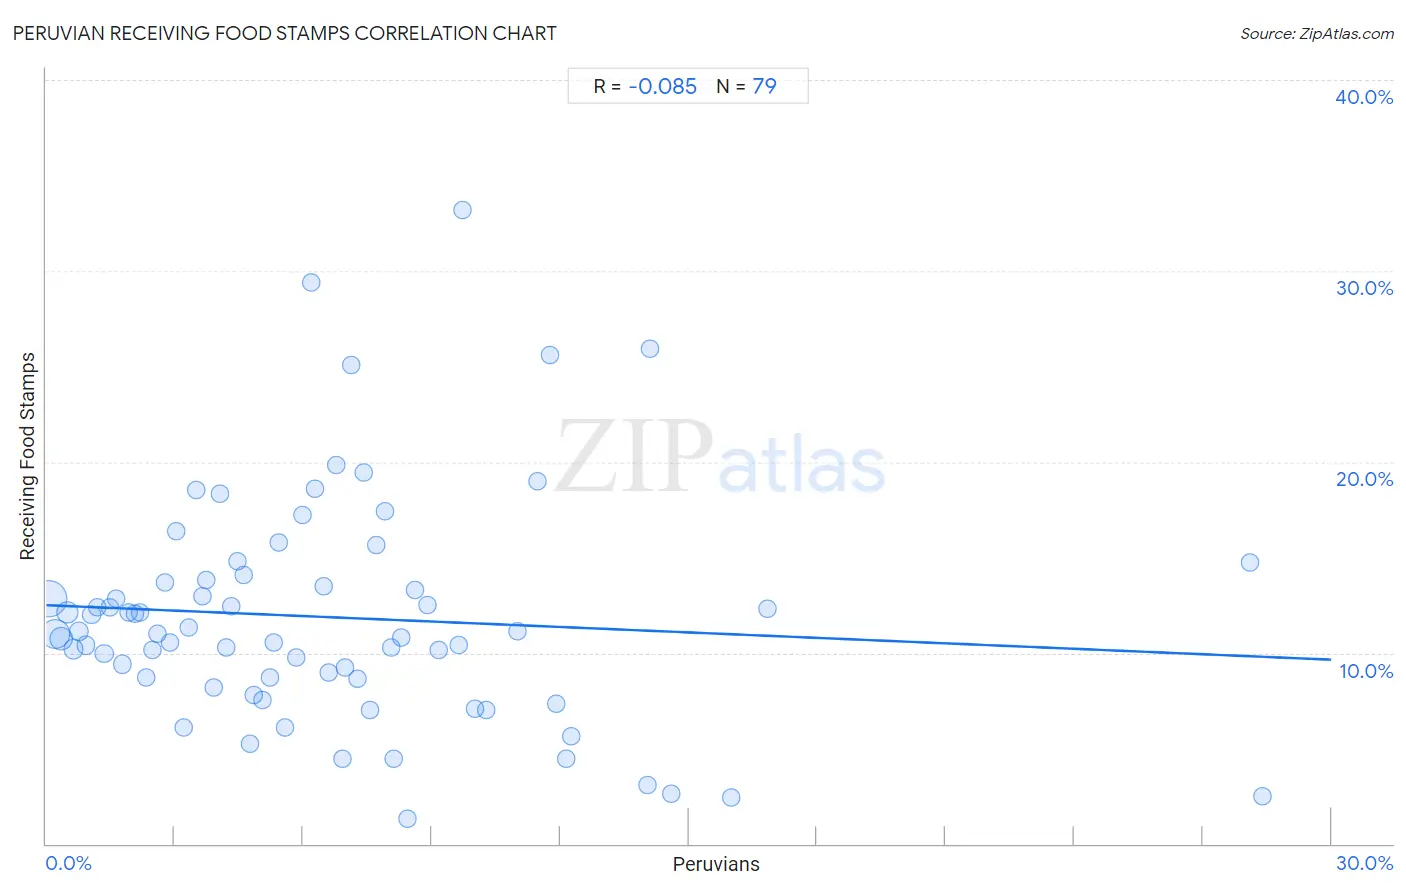
Peruvian Receiving Food Stamps Correlation Chart
The statistical analysis conducted on geographies consisting of 362,284,397 people shows a slight negative correlation between the proportion of Peruvians and percentage of population receiving government assistance and/or food stamps in the United States with a correlation coefficient (R) of -0.085 and weighted average of 11.7%. On average, for every 1% (one percent) increase in Peruvians within a typical geography, there is a decrease of 0.095% in percentage of population receiving government assistance and/or food stamps.
It is essential to understand that the correlation between the percentage of Peruvians and percentage of population receiving government assistance and/or food stamps does not imply a direct cause-and-effect relationship. It remains uncertain whether the presence of Peruvians influences an upward or downward trend in the level of percentage of population receiving government assistance and/or food stamps within an area, or if Peruvians simply ended up residing in those areas with higher or lower levels of percentage of population receiving government assistance and/or food stamps due to other factors.
Demographics Similar to Peruvians by Receiving Food Stamps
In terms of receiving food stamps, the demographic groups most similar to Peruvians are Osage (11.7%, a difference of 0.070%), Immigrants from Eritrea (11.7%, a difference of 0.10%), Immigrants from Ukraine (11.8%, a difference of 0.13%), German Russian (11.8%, a difference of 0.17%), and Immigrants from Kenya (11.8%, a difference of 0.41%).
| Demographics | Rating | Rank | Receiving Food Stamps |
| Immigrants from Eastern Africa | 58.3 /100 | #169 | Average 11.6% |
| Costa Ricans | 57.9 /100 | #170 | Average 11.6% |
| Immigrants from Western Asia | 56.4 /100 | #171 | Average 11.6% |
| Guamanians/Chamorros | 54.2 /100 | #172 | Average 11.7% |
| Immigrants from Syria | 53.4 /100 | #173 | Average 11.7% |
| Immigrants from Eritrea | 50.0 /100 | #174 | Average 11.7% |
| Osage | 49.8 /100 | #175 | Average 11.7% |
| Peruvians | 49.3 /100 | #176 | Average 11.7% |
| Immigrants from Ukraine | 48.4 /100 | #177 | Average 11.8% |
| German Russians | 48.1 /100 | #178 | Average 11.8% |
| Immigrants from Kenya | 46.4 /100 | #179 | Average 11.8% |
| Uruguayans | 44.8 /100 | #180 | Average 11.8% |
| South American Indians | 41.7 /100 | #181 | Average 11.9% |
| Immigrants from Morocco | 40.7 /100 | #182 | Average 11.9% |
| Immigrants from Uganda | 40.3 /100 | #183 | Average 11.9% |
Peruvian Receiving Food Stamps Correlation Summary
| Measurement | Peruvian Data | Receiving Food Stamps Data |
| Minimum | 0.070% | 1.3% |
| Maximum | 28.4% | 33.2% |
| Range | 28.3% | 31.9% |
| Mean | 6.6% | 11.9% |
| Median | 5.6% | 11.0% |
| Interquartile 25% (IQ1) | 2.8% | 8.7% |
| Interquartile 75% (IQ3) | 8.6% | 13.8% |
| Interquartile Range (IQR) | 5.8% | 5.1% |
| Standard Deviation (Sample) | 5.3% | 6.0% |
| Standard Deviation (Population) | 5.3% | 5.9% |
Correlation Details
| Peruvian Percentile | Sample Size | Receiving Food Stamps |
[ 0.0% - 0.5% ] 0.070% | 149,282,566 | 12.8% |
[ 0.0% - 0.5% ] 0.20% | 85,332,426 | 11.0% |
[ 0.0% - 0.5% ] 0.35% | 40,999,353 | 10.8% |
[ 0.0% - 0.5% ] 0.49% | 31,894,368 | 12.1% |
[ 0.5% - 1.0% ] 0.63% | 13,866,846 | 10.2% |
[ 0.5% - 1.0% ] 0.77% | 8,037,618 | 11.1% |
[ 0.5% - 1.0% ] 0.93% | 5,743,329 | 10.4% |
[ 1.0% - 1.5% ] 1.06% | 4,601,954 | 12.0% |
[ 1.0% - 1.5% ] 1.20% | 3,550,025 | 12.4% |
[ 1.0% - 1.5% ] 1.35% | 2,877,709 | 10.0% |
[ 1.0% - 1.5% ] 1.49% | 1,934,094 | 12.4% |
[ 1.5% - 2.0% ] 1.63% | 1,665,488 | 12.8% |
[ 1.5% - 2.0% ] 1.77% | 1,892,329 | 9.4% |
[ 1.5% - 2.0% ] 1.92% | 1,775,990 | 12.1% |
[ 2.0% - 2.5% ] 2.06% | 949,090 | 12.1% |
[ 2.0% - 2.5% ] 2.18% | 783,408 | 12.1% |
[ 2.0% - 2.5% ] 2.33% | 867,962 | 8.7% |
[ 2.0% - 2.5% ] 2.47% | 845,174 | 10.1% |
[ 2.5% - 3.0% ] 2.61% | 697,900 | 11.0% |
[ 2.5% - 3.0% ] 2.77% | 586,153 | 13.7% |
[ 2.5% - 3.0% ] 2.89% | 322,832 | 10.5% |
[ 3.0% - 3.5% ] 3.05% | 605,569 | 16.4% |
[ 3.0% - 3.5% ] 3.20% | 221,144 | 6.1% |
[ 3.0% - 3.5% ] 3.33% | 420,538 | 11.4% |
[ 3.0% - 3.5% ] 3.49% | 237,457 | 18.5% |
[ 3.5% - 4.0% ] 3.64% | 265,745 | 12.9% |
[ 3.5% - 4.0% ] 3.74% | 247,498 | 13.8% |
[ 3.5% - 4.0% ] 3.92% | 27,460 | 8.2% |
[ 4.0% - 4.5% ] 4.04% | 226,901 | 18.3% |
[ 4.0% - 4.5% ] 4.19% | 83,204 | 10.3% |
[ 4.0% - 4.5% ] 4.32% | 27,211 | 12.4% |
[ 4.0% - 4.5% ] 4.48% | 181,752 | 14.8% |
[ 4.5% - 5.0% ] 4.62% | 217,664 | 14.0% |
[ 4.5% - 5.0% ] 4.76% | 76,854 | 5.2% |
[ 4.5% - 5.0% ] 4.85% | 69,443 | 7.8% |
[ 5.0% - 5.5% ] 5.04% | 98,715 | 7.5% |
[ 5.0% - 5.5% ] 5.22% | 72,562 | 8.7% |
[ 5.0% - 5.5% ] 5.31% | 3,088 | 10.6% |
[ 5.0% - 5.5% ] 5.43% | 72,450 | 15.8% |
[ 5.5% - 6.0% ] 5.58% | 11,027 | 6.1% |
[ 5.5% - 6.0% ] 5.84% | 24,362 | 9.7% |
[ 5.5% - 6.0% ] 5.99% | 10,133 | 17.2% |
[ 6.0% - 6.5% ] 6.19% | 182,097 | 29.4% |
[ 6.0% - 6.5% ] 6.29% | 47,848 | 18.6% |
[ 6.0% - 6.5% ] 6.49% | 6,901 | 13.5% |
[ 6.5% - 7.0% ] 6.61% | 2,815 | 9.0% |
[ 6.5% - 7.0% ] 6.76% | 47,290 | 19.8% |
[ 6.5% - 7.0% ] 6.93% | 9,124 | 4.4% |
[ 6.5% - 7.0% ] 6.98% | 3,781 | 9.2% |
[ 7.0% - 7.5% ] 7.11% | 17,048 | 25.1% |
[ 7.0% - 7.5% ] 7.27% | 4,967 | 8.7% |
[ 7.0% - 7.5% ] 7.40% | 9,320 | 19.5% |
[ 7.5% - 8.0% ] 7.57% | 1,308 | 7.0% |
[ 7.5% - 8.0% ] 7.70% | 40,263 | 15.7% |
[ 7.5% - 8.0% ] 7.89% | 38,572 | 17.4% |
[ 8.0% - 8.5% ] 8.06% | 29,533 | 10.3% |
[ 8.0% - 8.5% ] 8.11% | 4,523 | 4.4% |
[ 8.0% - 8.5% ] 8.28% | 157 | 10.8% |
[ 8.0% - 8.5% ] 8.43% | 522 | 1.3% |
[ 8.5% - 9.0% ] 8.60% | 605 | 13.3% |
[ 8.5% - 9.0% ] 8.89% | 2,463 | 12.5% |
[ 9.0% - 9.5% ] 9.15% | 3,158 | 10.1% |
[ 9.5% - 10.0% ] 9.62% | 82,314 | 10.4% |
[ 9.5% - 10.0% ] 9.71% | 6,847 | 33.2% |
[ 10.0% - 10.5% ] 10.01% | 1,009 | 7.1% |
[ 10.0% - 10.5% ] 10.26% | 1,277 | 7.0% |
[ 11.0% - 11.5% ] 11.02% | 581 | 11.1% |
[ 11.0% - 11.5% ] 11.46% | 253 | 19.0% |
[ 11.5% - 12.0% ] 11.77% | 11,069 | 25.6% |
[ 11.5% - 12.0% ] 11.91% | 2,334 | 7.3% |
[ 12.0% - 12.5% ] 12.13% | 5,778 | 4.5% |
[ 12.0% - 12.5% ] 12.27% | 2,910 | 5.6% |
[ 14.0% - 14.5% ] 14.04% | 57 | 3.1% |
[ 14.0% - 14.5% ] 14.08% | 6,299 | 25.9% |
[ 14.5% - 15.0% ] 14.60% | 815 | 2.6% |
[ 15.5% - 16.0% ] 15.98% | 1,214 | 2.4% |
[ 16.5% - 17.0% ] 16.84% | 1,562 | 12.3% |
[ 28.0% - 28.5% ] 28.09% | 89 | 14.7% |
[ 28.0% - 28.5% ] 28.38% | 303 | 2.5% |