Peruvian Unemployment Among Women with Children Ages 6 to 17 years
COMPARE
Peruvian
Select to Compare
Unemployment Among Women with Children Ages 6 to 17 years
Peruvian Unemployment Among Women with Children Ages 6 to 17 years
9.2%
UNEMPLOYMENT | WOMEN W/ CHILDREN 6 TO 17
9.0/ 100
METRIC RATING
212th/ 347
METRIC RANK
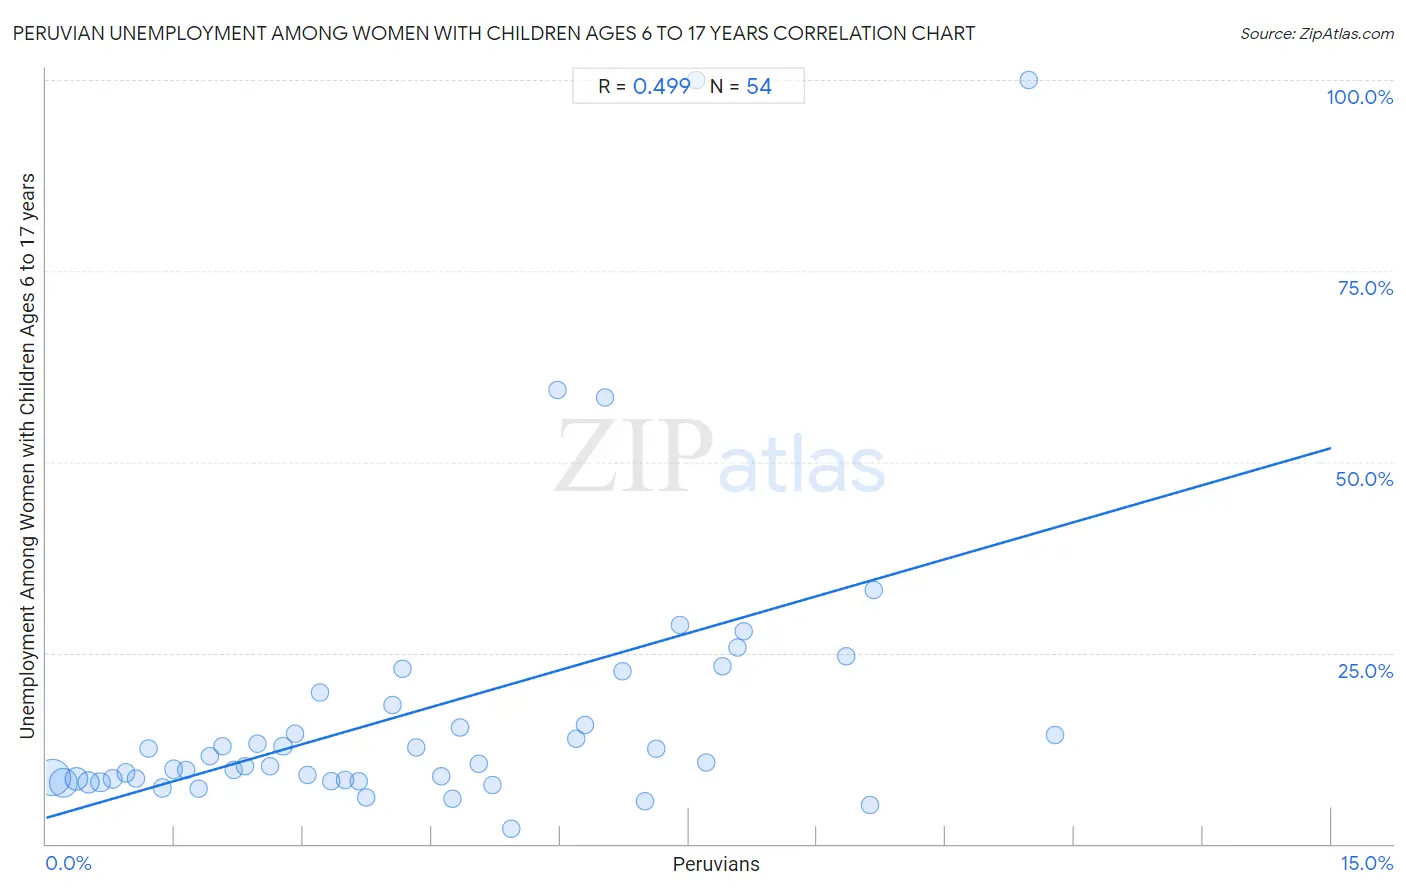
Peruvian Unemployment Among Women with Children Ages 6 to 17 years Correlation Chart
The statistical analysis conducted on geographies consisting of 270,138,716 people shows a moderate positive correlation between the proportion of Peruvians and unemployment rate among women with children between the ages 6 and 17 in the United States with a correlation coefficient (R) of 0.499 and weighted average of 9.2%. On average, for every 1% (one percent) increase in Peruvians within a typical geography, there is an increase of 3.2% in unemployment rate among women with children between the ages 6 and 17.
It is essential to understand that the correlation between the percentage of Peruvians and unemployment rate among women with children between the ages 6 and 17 does not imply a direct cause-and-effect relationship. It remains uncertain whether the presence of Peruvians influences an upward or downward trend in the level of unemployment rate among women with children between the ages 6 and 17 within an area, or if Peruvians simply ended up residing in those areas with higher or lower levels of unemployment rate among women with children between the ages 6 and 17 due to other factors.
Demographics Similar to Peruvians by Unemployment Among Women with Children Ages 6 to 17 years
In terms of unemployment among women with children ages 6 to 17 years, the demographic groups most similar to Peruvians are Immigrants from Cuba (9.2%, a difference of 0.080%), Spaniard (9.2%, a difference of 0.11%), Finnish (9.2%, a difference of 0.13%), Iroquois (9.2%, a difference of 0.21%), and Immigrants from Peru (9.2%, a difference of 0.22%).
| Demographics | Rating | Rank | Unemployment Among Women with Children Ages 6 to 17 years |
| Immigrants from Western Europe | 14.1 /100 | #205 | Poor 9.1% |
| Immigrants from North America | 12.7 /100 | #206 | Poor 9.2% |
| Cubans | 10.9 /100 | #207 | Poor 9.2% |
| Immigrants from Peru | 10.8 /100 | #208 | Poor 9.2% |
| Salvadorans | 10.7 /100 | #209 | Poor 9.2% |
| Finns | 10.0 /100 | #210 | Tragic 9.2% |
| Immigrants from Cuba | 9.6 /100 | #211 | Tragic 9.2% |
| Peruvians | 9.0 /100 | #212 | Tragic 9.2% |
| Spaniards | 8.2 /100 | #213 | Tragic 9.2% |
| Iroquois | 7.5 /100 | #214 | Tragic 9.2% |
| Immigrants from Germany | 7.2 /100 | #215 | Tragic 9.2% |
| Immigrants from Uruguay | 7.2 /100 | #216 | Tragic 9.2% |
| Germans | 7.2 /100 | #217 | Tragic 9.2% |
| Syrians | 6.9 /100 | #218 | Tragic 9.2% |
| Immigrants from Scotland | 6.6 /100 | #219 | Tragic 9.2% |
Peruvian Unemployment Among Women with Children Ages 6 to 17 years Correlation Summary
| Measurement | Peruvian Data | Unemployment Among Women with Children Ages 6 to 17 years Data |
| Minimum | 0.071% | 1.9% |
| Maximum | 11.8% | 100.0% |
| Range | 11.7% | 98.1% |
| Mean | 4.4% | 17.6% |
| Median | 3.9% | 10.6% |
| Interquartile 25% (IQ1) | 1.9% | 8.3% |
| Interquartile 75% (IQ3) | 6.7% | 18.2% |
| Interquartile Range (IQR) | 4.8% | 9.9% |
| Standard Deviation (Sample) | 3.0% | 19.7% |
| Standard Deviation (Population) | 3.0% | 19.5% |
Correlation Details
| Peruvian Percentile | Sample Size | Unemployment Among Women with Children Ages 6 to 17 years |
[ 0.0% - 0.5% ] 0.071% | 114,434,118 | 8.6% |
[ 0.0% - 0.5% ] 0.20% | 65,416,024 | 8.0% |
[ 0.0% - 0.5% ] 0.35% | 29,019,012 | 8.5% |
[ 0.0% - 0.5% ] 0.49% | 24,991,119 | 8.0% |
[ 0.5% - 1.0% ] 0.63% | 9,593,675 | 8.0% |
[ 0.5% - 1.0% ] 0.77% | 5,392,722 | 8.4% |
[ 0.5% - 1.0% ] 0.93% | 3,576,453 | 9.3% |
[ 1.0% - 1.5% ] 1.05% | 3,073,093 | 8.6% |
[ 1.0% - 1.5% ] 1.19% | 2,653,438 | 12.4% |
[ 1.0% - 1.5% ] 1.35% | 1,869,448 | 7.3% |
[ 1.0% - 1.5% ] 1.49% | 1,314,432 | 9.7% |
[ 1.5% - 2.0% ] 1.63% | 942,096 | 9.6% |
[ 1.5% - 2.0% ] 1.77% | 1,258,037 | 7.2% |
[ 1.5% - 2.0% ] 1.92% | 1,337,924 | 11.5% |
[ 2.0% - 2.5% ] 2.06% | 489,981 | 12.8% |
[ 2.0% - 2.5% ] 2.18% | 516,208 | 9.7% |
[ 2.0% - 2.5% ] 2.32% | 379,264 | 10.2% |
[ 2.0% - 2.5% ] 2.46% | 493,653 | 13.0% |
[ 2.5% - 3.0% ] 2.61% | 242,454 | 10.2% |
[ 2.5% - 3.0% ] 2.76% | 376,589 | 12.7% |
[ 2.5% - 3.0% ] 2.90% | 102,832 | 14.4% |
[ 3.0% - 3.5% ] 3.05% | 444,980 | 8.9% |
[ 3.0% - 3.5% ] 3.20% | 150,571 | 19.8% |
[ 3.0% - 3.5% ] 3.33% | 292,294 | 8.2% |
[ 3.0% - 3.5% ] 3.49% | 205,424 | 8.3% |
[ 3.5% - 4.0% ] 3.65% | 243,238 | 8.1% |
[ 3.5% - 4.0% ] 3.73% | 169,162 | 6.0% |
[ 4.0% - 4.5% ] 4.05% | 217,340 | 18.2% |
[ 4.0% - 4.5% ] 4.15% | 15,573 | 22.9% |
[ 4.0% - 4.5% ] 4.32% | 20,873 | 12.6% |
[ 4.5% - 5.0% ] 4.61% | 134,124 | 8.8% |
[ 4.5% - 5.0% ] 4.75% | 59,421 | 5.9% |
[ 4.5% - 5.0% ] 4.84% | 48,076 | 15.2% |
[ 5.0% - 5.5% ] 5.04% | 70,787 | 10.6% |
[ 5.0% - 5.5% ] 5.22% | 71,584 | 7.7% |
[ 5.0% - 5.5% ] 5.42% | 43,269 | 1.9% |
[ 5.5% - 6.0% ] 5.97% | 4,861 | 59.4% |
[ 6.0% - 6.5% ] 6.19% | 157,864 | 13.8% |
[ 6.0% - 6.5% ] 6.29% | 46,427 | 15.5% |
[ 6.5% - 7.0% ] 6.52% | 4,647 | 58.5% |
[ 6.5% - 7.0% ] 6.73% | 24,912 | 22.6% |
[ 6.5% - 7.0% ] 6.98% | 3,781 | 5.6% |
[ 7.0% - 7.5% ] 7.12% | 9,863 | 12.4% |
[ 7.0% - 7.5% ] 7.40% | 8,945 | 28.7% |
[ 7.5% - 8.0% ] 7.58% | 963 | 100.0% |
[ 7.5% - 8.0% ] 7.70% | 40,042 | 10.7% |
[ 7.5% - 8.0% ] 7.89% | 36,545 | 23.2% |
[ 8.0% - 8.5% ] 8.07% | 21,935 | 25.7% |
[ 8.0% - 8.5% ] 8.14% | 1,056 | 27.8% |
[ 9.0% - 9.5% ] 9.34% | 22,377 | 24.6% |
[ 9.5% - 10.0% ] 9.62% | 82,314 | 5.1% |
[ 9.5% - 10.0% ] 9.66% | 1,574 | 33.3% |
[ 11.0% - 11.5% ] 11.46% | 253 | 100.0% |
[ 11.5% - 12.0% ] 11.77% | 11,069 | 14.3% |