Peruvian Wage/Income Gap
COMPARE
Peruvian
Select to Compare
Wage/Income Gap
Peruvian Wage/Income Gap
25.6%
WAGE/INCOME GAP
60.1/ 100
METRIC RATING
169th/ 347
METRIC RANK
Peruvian Wage/Income Gap Correlation Chart
The statistical analysis conducted on geographies consisting of 363,114,915 people shows no correlation between the proportion of Peruvians and wage/income gap percentage in the United States with a correlation coefficient (R) of 0.033 and weighted average of 25.6%. On average, for every 1% (one percent) increase in Peruvians within a typical geography, there is an increase of 0.071% in wage/income gap percentage.
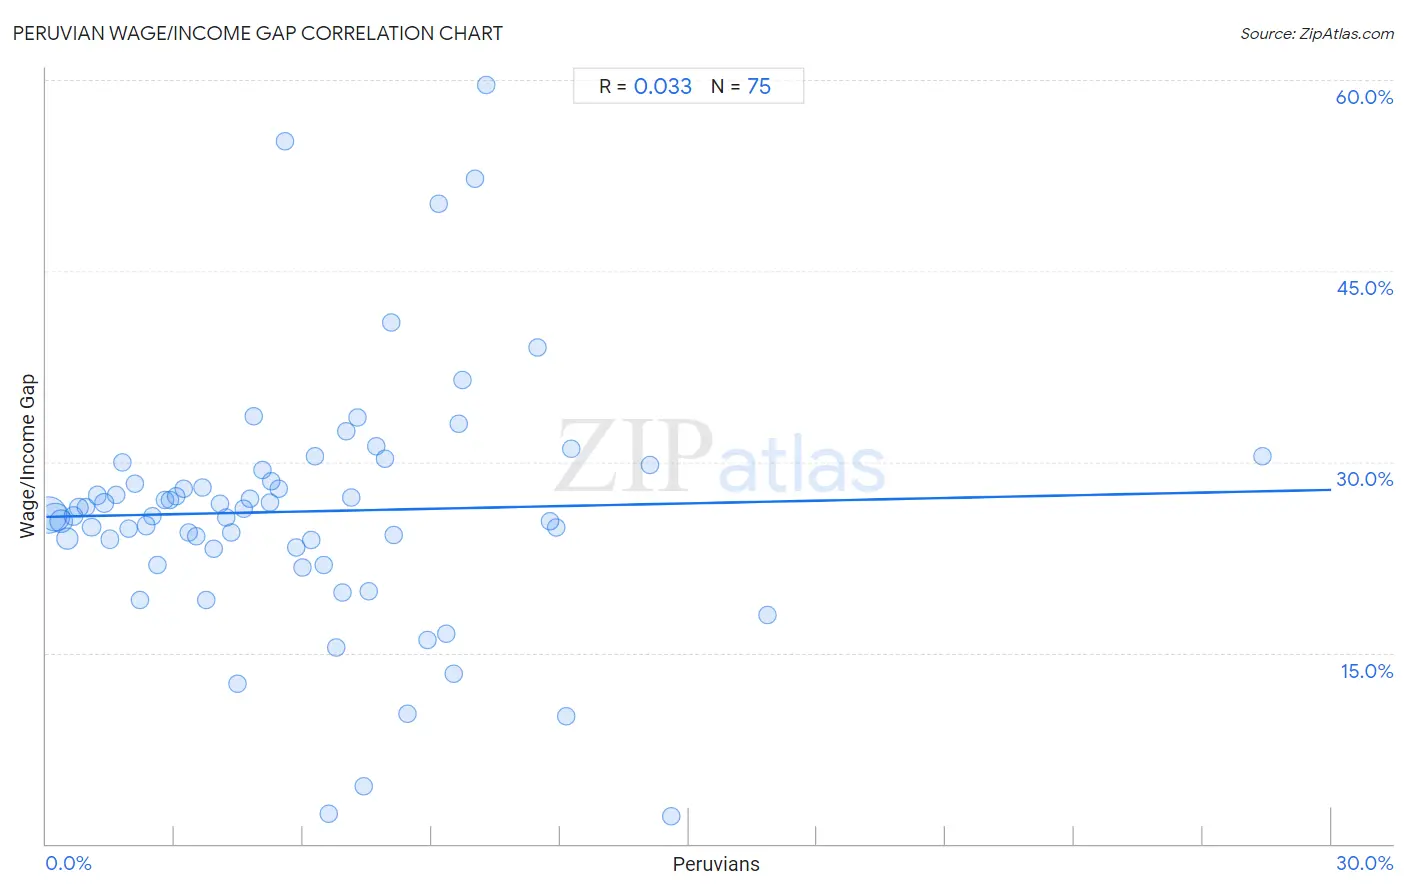
It is essential to understand that the correlation between the percentage of Peruvians and wage/income gap percentage does not imply a direct cause-and-effect relationship. It remains uncertain whether the presence of Peruvians influences an upward or downward trend in the level of wage/income gap percentage within an area, or if Peruvians simply ended up residing in those areas with higher or lower levels of wage/income gap percentage due to other factors.
Demographics Similar to Peruvians by Wage/Income Gap
In terms of wage/income gap, the demographic groups most similar to Peruvians are Immigrants from Oceania (25.6%, a difference of 0.17%), Seminole (25.6%, a difference of 0.18%), Paiute (25.5%, a difference of 0.20%), Immigrants from Greece (25.7%, a difference of 0.23%), and Immigrants from Ukraine (25.5%, a difference of 0.26%).
| Demographics | Rating | Rank | Wage/Income Gap |
| Shoshone | 69.0 /100 | #162 | Good 25.4% |
| Native Hawaiians | 69.0 /100 | #163 | Good 25.4% |
| Koreans | 68.6 /100 | #164 | Good 25.4% |
| Immigrants from Hong Kong | 64.0 /100 | #165 | Good 25.5% |
| Immigrants from Ukraine | 63.8 /100 | #166 | Good 25.5% |
| Paiute | 62.9 /100 | #167 | Good 25.5% |
| Seminole | 62.6 /100 | #168 | Good 25.6% |
| Peruvians | 60.1 /100 | #169 | Good 25.6% |
| Immigrants from Oceania | 57.5 /100 | #170 | Average 25.6% |
| Immigrants from Greece | 56.6 /100 | #171 | Average 25.7% |
| Immigrants from Chile | 53.2 /100 | #172 | Average 25.7% |
| Immigrants from Belarus | 52.9 /100 | #173 | Average 25.7% |
| Alaskan Athabascans | 50.0 /100 | #174 | Average 25.8% |
| Sri Lankans | 47.0 /100 | #175 | Average 25.8% |
| Paraguayans | 46.7 /100 | #176 | Average 25.8% |
Peruvian Wage/Income Gap Correlation Summary
| Measurement | Peruvian Data | Wage/Income Gap Data |
| Minimum | 0.070% | 2.2% |
| Maximum | 28.4% | 59.6% |
| Range | 28.3% | 57.4% |
| Mean | 6.0% | 26.1% |
| Median | 5.3% | 25.9% |
| Interquartile 25% (IQ1) | 2.6% | 23.1% |
| Interquartile 75% (IQ3) | 8.1% | 29.3% |
| Interquartile Range (IQR) | 5.5% | 6.2% |
| Standard Deviation (Sample) | 4.6% | 9.9% |
| Standard Deviation (Population) | 4.6% | 9.8% |
Correlation Details
| Peruvian Percentile | Sample Size | Wage/Income Gap |
[ 0.0% - 0.5% ] 0.070% | 149,468,379 | 25.9% |
[ 0.0% - 0.5% ] 0.20% | 85,476,059 | 25.7% |
[ 0.0% - 0.5% ] 0.35% | 41,155,729 | 25.4% |
[ 0.0% - 0.5% ] 0.49% | 31,969,303 | 24.0% |
[ 0.5% - 1.0% ] 0.63% | 13,907,260 | 25.7% |
[ 0.5% - 1.0% ] 0.77% | 8,071,673 | 26.4% |
[ 0.5% - 1.0% ] 0.93% | 5,764,753 | 26.4% |
[ 1.0% - 1.5% ] 1.06% | 4,651,630 | 24.9% |
[ 1.0% - 1.5% ] 1.20% | 3,570,586 | 27.4% |
[ 1.0% - 1.5% ] 1.35% | 2,890,956 | 26.8% |
[ 1.0% - 1.5% ] 1.49% | 1,930,084 | 23.9% |
[ 1.5% - 2.0% ] 1.63% | 1,667,970 | 27.4% |
[ 1.5% - 2.0% ] 1.77% | 1,891,691 | 29.9% |
[ 1.5% - 2.0% ] 1.92% | 1,777,656 | 24.8% |
[ 2.0% - 2.5% ] 2.06% | 1,006,445 | 28.2% |
[ 2.0% - 2.5% ] 2.18% | 784,069 | 19.2% |
[ 2.0% - 2.5% ] 2.33% | 868,482 | 25.0% |
[ 2.0% - 2.5% ] 2.47% | 842,380 | 25.7% |
[ 2.5% - 3.0% ] 2.61% | 699,000 | 21.9% |
[ 2.5% - 3.0% ] 2.77% | 585,704 | 27.0% |
[ 2.5% - 3.0% ] 2.89% | 324,767 | 27.0% |
[ 3.0% - 3.5% ] 3.05% | 605,569 | 27.3% |
[ 3.0% - 3.5% ] 3.20% | 221,467 | 27.9% |
[ 3.0% - 3.5% ] 3.33% | 419,774 | 24.4% |
[ 3.0% - 3.5% ] 3.49% | 237,237 | 24.2% |
[ 3.5% - 4.0% ] 3.64% | 265,745 | 28.0% |
[ 3.5% - 4.0% ] 3.74% | 247,498 | 19.2% |
[ 3.5% - 4.0% ] 3.92% | 28,451 | 23.1% |
[ 4.0% - 4.5% ] 4.04% | 226,901 | 26.7% |
[ 4.0% - 4.5% ] 4.19% | 81,681 | 25.7% |
[ 4.0% - 4.5% ] 4.32% | 27,211 | 24.4% |
[ 4.0% - 4.5% ] 4.48% | 181,752 | 12.6% |
[ 4.5% - 5.0% ] 4.62% | 217,878 | 26.3% |
[ 4.5% - 5.0% ] 4.76% | 76,854 | 27.1% |
[ 4.5% - 5.0% ] 4.85% | 69,443 | 33.6% |
[ 5.0% - 5.5% ] 5.04% | 98,715 | 29.3% |
[ 5.0% - 5.5% ] 5.22% | 72,562 | 26.9% |
[ 5.0% - 5.5% ] 5.26% | 1,729 | 28.5% |
[ 5.0% - 5.5% ] 5.43% | 72,450 | 27.9% |
[ 5.5% - 6.0% ] 5.58% | 11,027 | 55.2% |
[ 5.5% - 6.0% ] 5.85% | 27,966 | 23.3% |
[ 5.5% - 6.0% ] 5.99% | 10,133 | 21.7% |
[ 6.0% - 6.5% ] 6.19% | 182,097 | 23.9% |
[ 6.0% - 6.5% ] 6.29% | 47,848 | 30.5% |
[ 6.0% - 6.5% ] 6.46% | 12,421 | 21.9% |
[ 6.5% - 7.0% ] 6.61% | 2,815 | 2.3% |
[ 6.5% - 7.0% ] 6.76% | 47,290 | 15.4% |
[ 6.5% - 7.0% ] 6.90% | 12,692 | 19.8% |
[ 7.0% - 7.5% ] 7.00% | 7,011 | 32.4% |
[ 7.0% - 7.5% ] 7.11% | 17,048 | 27.2% |
[ 7.0% - 7.5% ] 7.27% | 4,967 | 33.4% |
[ 7.0% - 7.5% ] 7.40% | 8,945 | 4.5% |
[ 7.5% - 8.0% ] 7.54% | 345 | 19.8% |
[ 7.5% - 8.0% ] 7.70% | 40,042 | 31.2% |
[ 7.5% - 8.0% ] 7.89% | 38,572 | 30.2% |
[ 8.0% - 8.5% ] 8.06% | 29,533 | 41.0% |
[ 8.0% - 8.5% ] 8.11% | 4,523 | 24.3% |
[ 8.0% - 8.5% ] 8.43% | 522 | 10.3% |
[ 8.5% - 9.0% ] 8.89% | 2,463 | 16.0% |
[ 9.0% - 9.5% ] 9.15% | 3,158 | 50.3% |
[ 9.0% - 9.5% ] 9.34% | 22,377 | 16.5% |
[ 9.5% - 10.0% ] 9.51% | 568 | 13.4% |
[ 9.5% - 10.0% ] 9.62% | 82,314 | 33.0% |
[ 9.5% - 10.0% ] 9.71% | 6,847 | 36.5% |
[ 10.0% - 10.5% ] 10.02% | 1,298 | 52.2% |
[ 10.0% - 10.5% ] 10.26% | 1,277 | 59.6% |
[ 11.0% - 11.5% ] 11.46% | 253 | 39.0% |
[ 11.5% - 12.0% ] 11.77% | 11,069 | 25.3% |
[ 11.5% - 12.0% ] 11.91% | 2,334 | 24.8% |
[ 12.0% - 12.5% ] 12.13% | 5,778 | 10.0% |
[ 12.0% - 12.5% ] 12.27% | 2,910 | 31.0% |
[ 14.0% - 14.5% ] 14.08% | 6,299 | 29.8% |
[ 14.5% - 15.0% ] 14.60% | 815 | 2.2% |
[ 16.5% - 17.0% ] 16.84% | 1,562 | 18.0% |
[ 28.0% - 28.5% ] 28.38% | 303 | 30.5% |