Peruvian Married-couple Households
COMPARE
Peruvian
Select to Compare
Married-couple Households
Peruvian Married-couple Households
47.6%
MARRIED-COUPLE HOUSEHOLDS
93.8/ 100
METRIC RATING
112th/ 347
METRIC RANK
Peruvian Married-couple Households Correlation Chart
The statistical analysis conducted on geographies consisting of 362,959,523 people shows a weak negative correlation between the proportion of Peruvians and percentage of married-couple family households in the United States with a correlation coefficient (R) of -0.249 and weighted average of 47.6%. On average, for every 1% (one percent) increase in Peruvians within a typical geography, there is a decrease of 0.29% in percentage of married-couple family households.
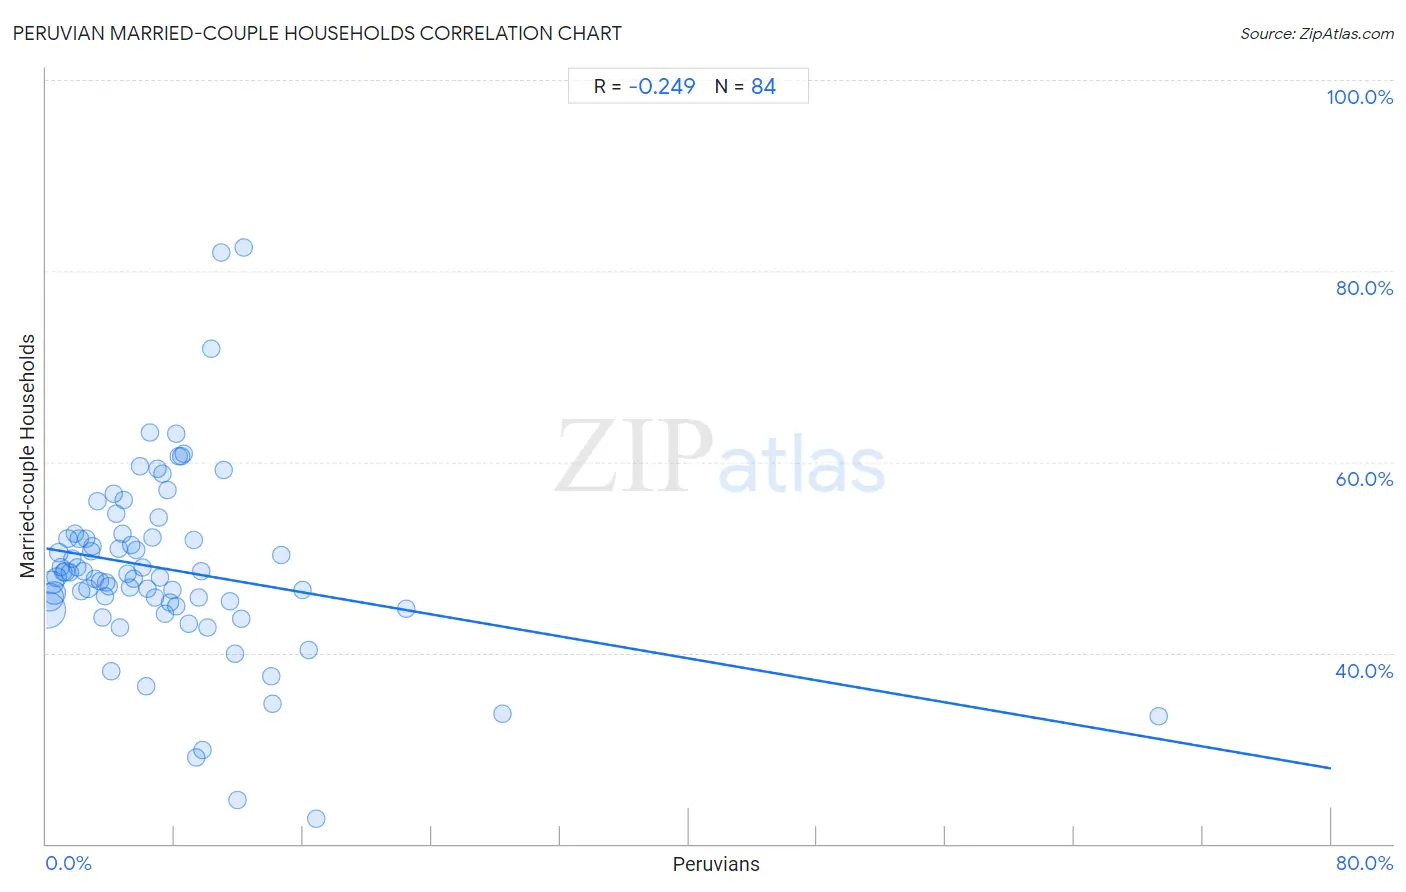
It is essential to understand that the correlation between the percentage of Peruvians and percentage of married-couple family households does not imply a direct cause-and-effect relationship. It remains uncertain whether the presence of Peruvians influences an upward or downward trend in the level of percentage of married-couple family households within an area, or if Peruvians simply ended up residing in those areas with higher or lower levels of percentage of married-couple family households due to other factors.
Demographics Similar to Peruvians by Married-couple Households
In terms of married-couple households, the demographic groups most similar to Peruvians are Syrian (47.6%, a difference of 0.010%), Venezuelan (47.6%, a difference of 0.010%), Macedonian (47.6%, a difference of 0.020%), Immigrants from Europe (47.6%, a difference of 0.020%), and Immigrants from Jordan (47.7%, a difference of 0.040%).
| Demographics | Rating | Rank | Married-couple Households |
| Immigrants from Czechoslovakia | 95.5 /100 | #105 | Exceptional 47.8% |
| Portuguese | 95.5 /100 | #106 | Exceptional 47.8% |
| Estonians | 94.7 /100 | #107 | Exceptional 47.7% |
| Immigrants from Japan | 94.4 /100 | #108 | Exceptional 47.7% |
| Immigrants from Jordan | 94.1 /100 | #109 | Exceptional 47.7% |
| Macedonians | 93.9 /100 | #110 | Exceptional 47.6% |
| Syrians | 93.9 /100 | #111 | Exceptional 47.6% |
| Peruvians | 93.8 /100 | #112 | Exceptional 47.6% |
| Venezuelans | 93.8 /100 | #113 | Exceptional 47.6% |
| Immigrants from Europe | 93.7 /100 | #114 | Exceptional 47.6% |
| Slovaks | 92.9 /100 | #115 | Exceptional 47.6% |
| Argentineans | 92.5 /100 | #116 | Exceptional 47.5% |
| French Canadians | 92.4 /100 | #117 | Exceptional 47.5% |
| Immigrants from Germany | 92.4 /100 | #118 | Exceptional 47.5% |
| Chileans | 92.2 /100 | #119 | Exceptional 47.5% |
Peruvian Married-couple Households Correlation Summary
| Measurement | Peruvian Data | Married-couple Households Data |
| Minimum | 0.070% | 22.6% |
| Maximum | 69.3% | 82.5% |
| Range | 69.2% | 60.0% |
| Mean | 7.5% | 48.8% |
| Median | 6.1% | 48.1% |
| Interquartile 25% (IQ1) | 3.0% | 45.0% |
| Interquartile 75% (IQ3) | 9.4% | 52.0% |
| Interquartile Range (IQR) | 6.5% | 7.0% |
| Standard Deviation (Sample) | 8.5% | 9.8% |
| Standard Deviation (Population) | 8.5% | 9.8% |
Correlation Details
| Peruvian Percentile | Sample Size | Married-couple Households |
[ 0.0% - 0.5% ] 0.070% | 149,420,104 | 44.5% |
[ 0.0% - 0.5% ] 0.20% | 85,419,586 | 45.8% |
[ 0.0% - 0.5% ] 0.35% | 41,120,151 | 47.4% |
[ 0.0% - 0.5% ] 0.49% | 31,960,072 | 46.3% |
[ 0.5% - 1.0% ] 0.63% | 13,869,400 | 47.9% |
[ 0.5% - 1.0% ] 0.77% | 8,069,313 | 50.5% |
[ 0.5% - 1.0% ] 0.93% | 5,763,338 | 49.0% |
[ 1.0% - 1.5% ] 1.06% | 4,649,640 | 48.4% |
[ 1.0% - 1.5% ] 1.20% | 3,568,252 | 48.5% |
[ 1.0% - 1.5% ] 1.35% | 2,892,145 | 52.0% |
[ 1.0% - 1.5% ] 1.49% | 1,935,869 | 48.4% |
[ 1.5% - 2.0% ] 1.63% | 1,667,661 | 49.9% |
[ 1.5% - 2.0% ] 1.77% | 1,892,557 | 52.4% |
[ 1.5% - 2.0% ] 1.92% | 1,780,358 | 49.0% |
[ 2.0% - 2.5% ] 2.06% | 1,006,516 | 52.0% |
[ 2.0% - 2.5% ] 2.18% | 787,207 | 46.5% |
[ 2.0% - 2.5% ] 2.33% | 869,027 | 48.5% |
[ 2.0% - 2.5% ] 2.47% | 845,174 | 52.0% |
[ 2.5% - 3.0% ] 2.61% | 700,044 | 46.7% |
[ 2.5% - 3.0% ] 2.77% | 586,153 | 50.7% |
[ 2.5% - 3.0% ] 2.89% | 325,365 | 51.2% |
[ 3.0% - 3.5% ] 3.05% | 606,728 | 47.8% |
[ 3.0% - 3.5% ] 3.20% | 223,697 | 55.9% |
[ 3.0% - 3.5% ] 3.33% | 421,179 | 47.5% |
[ 3.0% - 3.5% ] 3.49% | 238,569 | 43.7% |
[ 3.5% - 4.0% ] 3.64% | 265,745 | 45.9% |
[ 3.5% - 4.0% ] 3.74% | 248,036 | 47.4% |
[ 3.5% - 4.0% ] 3.92% | 28,885 | 46.9% |
[ 4.0% - 4.5% ] 4.04% | 226,901 | 38.1% |
[ 4.0% - 4.5% ] 4.19% | 83,204 | 56.6% |
[ 4.0% - 4.5% ] 4.32% | 27,211 | 54.6% |
[ 4.0% - 4.5% ] 4.48% | 182,702 | 50.9% |
[ 4.5% - 5.0% ] 4.62% | 217,878 | 42.6% |
[ 4.5% - 5.0% ] 4.76% | 77,760 | 52.5% |
[ 4.5% - 5.0% ] 4.85% | 69,443 | 56.0% |
[ 5.0% - 5.5% ] 5.04% | 98,715 | 48.3% |
[ 5.0% - 5.5% ] 5.22% | 72,562 | 46.8% |
[ 5.0% - 5.5% ] 5.31% | 3,088 | 51.3% |
[ 5.0% - 5.5% ] 5.43% | 72,450 | 47.7% |
[ 5.5% - 6.0% ] 5.58% | 11,743 | 50.8% |
[ 5.5% - 6.0% ] 5.85% | 29,593 | 59.5% |
[ 5.5% - 6.0% ] 5.99% | 10,133 | 48.9% |
[ 6.0% - 6.5% ] 6.19% | 182,097 | 36.5% |
[ 6.0% - 6.5% ] 6.29% | 47,848 | 46.7% |
[ 6.0% - 6.5% ] 6.46% | 12,421 | 63.1% |
[ 6.5% - 7.0% ] 6.61% | 2,815 | 52.1% |
[ 6.5% - 7.0% ] 6.76% | 47,290 | 45.8% |
[ 6.5% - 7.0% ] 6.90% | 12,692 | 59.2% |
[ 7.0% - 7.5% ] 7.00% | 7,212 | 54.2% |
[ 7.0% - 7.5% ] 7.11% | 17,048 | 47.8% |
[ 7.0% - 7.5% ] 7.27% | 4,967 | 58.7% |
[ 7.0% - 7.5% ] 7.40% | 9,320 | 44.0% |
[ 7.5% - 8.0% ] 7.57% | 1,308 | 57.0% |
[ 7.5% - 8.0% ] 7.70% | 40,263 | 45.2% |
[ 7.5% - 8.0% ] 7.89% | 38,572 | 46.5% |
[ 8.0% - 8.5% ] 8.06% | 29,533 | 44.9% |
[ 8.0% - 8.5% ] 8.11% | 4,523 | 62.9% |
[ 8.0% - 8.5% ] 8.29% | 1,231 | 60.6% |
[ 8.0% - 8.5% ] 8.43% | 522 | 60.6% |
[ 8.5% - 9.0% ] 8.60% | 605 | 60.9% |
[ 8.5% - 9.0% ] 8.89% | 2,463 | 43.1% |
[ 9.0% - 9.5% ] 9.16% | 3,528 | 51.8% |
[ 9.0% - 9.5% ] 9.34% | 22,377 | 29.0% |
[ 9.5% - 10.0% ] 9.51% | 568 | 45.8% |
[ 9.5% - 10.0% ] 9.62% | 82,314 | 48.5% |
[ 9.5% - 10.0% ] 9.71% | 6,847 | 29.8% |
[ 10.0% - 10.5% ] 10.02% | 1,298 | 42.6% |
[ 10.0% - 10.5% ] 10.28% | 1,848 | 71.8% |
[ 10.5% - 11.0% ] 10.87% | 276 | 81.9% |
[ 11.0% - 11.5% ] 11.02% | 581 | 59.2% |
[ 11.0% - 11.5% ] 11.46% | 253 | 45.5% |
[ 11.5% - 12.0% ] 11.77% | 11,069 | 40.0% |
[ 11.5% - 12.0% ] 11.91% | 2,334 | 24.6% |
[ 12.0% - 12.5% ] 12.13% | 5,778 | 43.6% |
[ 12.0% - 12.5% ] 12.27% | 2,910 | 82.5% |
[ 14.0% - 14.5% ] 14.04% | 57 | 37.5% |
[ 14.0% - 14.5% ] 14.08% | 6,299 | 34.6% |
[ 14.5% - 15.0% ] 14.60% | 815 | 50.2% |
[ 15.5% - 16.0% ] 15.98% | 1,214 | 46.6% |
[ 16.0% - 16.5% ] 16.33% | 98 | 40.3% |
[ 16.5% - 17.0% ] 16.84% | 1,562 | 22.6% |
[ 22.0% - 22.5% ] 22.45% | 196 | 44.6% |
[ 28.0% - 28.5% ] 28.38% | 303 | 33.6% |
[ 69.0% - 69.5% ] 69.30% | 114 | 33.3% |