Peruvian GED/Equivalency
COMPARE
Peruvian
Select to Compare
GED/Equivalency
Peruvian GED/Equivalency
84.7%
GED/EQUIVALENCY
9.2/ 100
METRIC RATING
215th/ 347
METRIC RANK
Peruvian GED/Equivalency Correlation Chart
The statistical analysis conducted on geographies consisting of 363,251,075 people shows a poor negative correlation between the proportion of Peruvians and percentage of population with at least ged/equivalency education in the United States with a correlation coefficient (R) of -0.148 and weighted average of 84.7%. On average, for every 1% (one percent) increase in Peruvians within a typical geography, there is a decrease of 0.11% in percentage of population with at least ged/equivalency education.
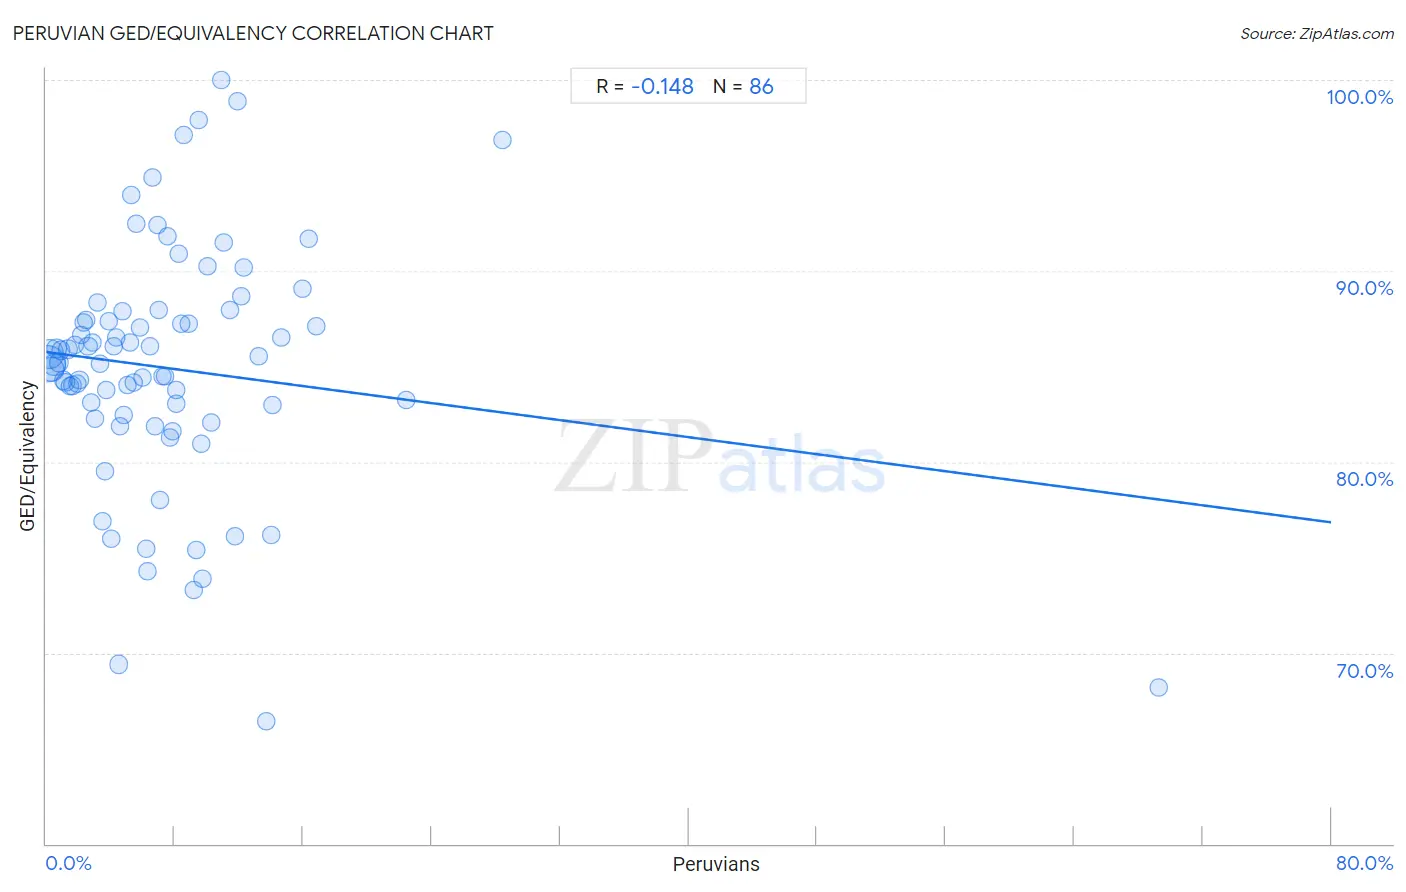
It is essential to understand that the correlation between the percentage of Peruvians and percentage of population with at least ged/equivalency education does not imply a direct cause-and-effect relationship. It remains uncertain whether the presence of Peruvians influences an upward or downward trend in the level of percentage of population with at least ged/equivalency education within an area, or if Peruvians simply ended up residing in those areas with higher or lower levels of percentage of population with at least ged/equivalency education due to other factors.
Demographics Similar to Peruvians by GED/Equivalency
In terms of ged/equivalency, the demographic groups most similar to Peruvians are Osage (84.8%, a difference of 0.020%), Immigrants from Micronesia (84.7%, a difference of 0.030%), Nigerian (84.7%, a difference of 0.030%), Alaska Native (84.7%, a difference of 0.030%), and Immigrants from Philippines (84.8%, a difference of 0.050%).
| Demographics | Rating | Rank | GED/Equivalency |
| Marshallese | 12.5 /100 | #208 | Poor 84.9% |
| Colombians | 12.3 /100 | #209 | Poor 84.9% |
| Immigrants from Cameroon | 12.1 /100 | #210 | Poor 84.9% |
| South Americans | 10.9 /100 | #211 | Poor 84.8% |
| Immigrants from Somalia | 10.6 /100 | #212 | Poor 84.8% |
| Immigrants from Philippines | 10.0 /100 | #213 | Poor 84.8% |
| Osage | 9.5 /100 | #214 | Tragic 84.8% |
| Peruvians | 9.2 /100 | #215 | Tragic 84.7% |
| Immigrants from Micronesia | 8.7 /100 | #216 | Tragic 84.7% |
| Nigerians | 8.6 /100 | #217 | Tragic 84.7% |
| Alaska Natives | 8.6 /100 | #218 | Tragic 84.7% |
| Potawatomi | 8.2 /100 | #219 | Tragic 84.7% |
| Americans | 8.2 /100 | #220 | Tragic 84.7% |
| Taiwanese | 8.1 /100 | #221 | Tragic 84.7% |
| Iroquois | 7.5 /100 | #222 | Tragic 84.6% |
Peruvian GED/Equivalency Correlation Summary
| Measurement | Peruvian Data | GED/Equivalency Data |
| Minimum | 0.070% | 66.4% |
| Maximum | 69.3% | 100.0% |
| Range | 69.2% | 33.6% |
| Mean | 7.6% | 84.9% |
| Median | 6.2% | 85.2% |
| Interquartile 25% (IQ1) | 3.0% | 82.5% |
| Interquartile 75% (IQ3) | 9.6% | 87.5% |
| Interquartile Range (IQR) | 6.6% | 5.0% |
| Standard Deviation (Sample) | 8.5% | 6.4% |
| Standard Deviation (Population) | 8.4% | 6.3% |
Correlation Details
| Peruvian Percentile | Sample Size | GED/Equivalency |
[ 0.0% - 0.5% ] 0.070% | 149,481,303 | 85.1% |
[ 0.0% - 0.5% ] 0.20% | 85,490,093 | 85.7% |
[ 0.0% - 0.5% ] 0.35% | 41,170,527 | 84.8% |
[ 0.0% - 0.5% ] 0.49% | 31,981,730 | 85.1% |
[ 0.5% - 1.0% ] 0.63% | 13,916,731 | 85.9% |
[ 0.5% - 1.0% ] 0.77% | 8,080,597 | 85.2% |
[ 0.5% - 1.0% ] 0.93% | 5,768,493 | 85.8% |
[ 1.0% - 1.5% ] 1.06% | 4,659,088 | 84.3% |
[ 1.0% - 1.5% ] 1.20% | 3,572,526 | 84.2% |
[ 1.0% - 1.5% ] 1.35% | 2,895,833 | 85.9% |
[ 1.0% - 1.5% ] 1.49% | 1,936,679 | 84.0% |
[ 1.5% - 2.0% ] 1.63% | 1,667,661 | 84.0% |
[ 1.5% - 2.0% ] 1.77% | 1,892,889 | 86.1% |
[ 1.5% - 2.0% ] 1.92% | 1,780,358 | 84.1% |
[ 2.0% - 2.5% ] 2.06% | 1,007,755 | 84.3% |
[ 2.0% - 2.5% ] 2.18% | 787,207 | 86.7% |
[ 2.0% - 2.5% ] 2.33% | 869,027 | 87.3% |
[ 2.0% - 2.5% ] 2.47% | 847,314 | 87.5% |
[ 2.5% - 3.0% ] 2.61% | 700,044 | 86.0% |
[ 2.5% - 3.0% ] 2.77% | 587,574 | 83.1% |
[ 2.5% - 3.0% ] 2.89% | 325,365 | 86.2% |
[ 3.0% - 3.5% ] 3.05% | 606,728 | 82.3% |
[ 3.0% - 3.5% ] 3.20% | 223,697 | 88.3% |
[ 3.0% - 3.5% ] 3.33% | 421,179 | 85.1% |
[ 3.0% - 3.5% ] 3.49% | 238,569 | 76.9% |
[ 3.5% - 4.0% ] 3.64% | 265,745 | 79.5% |
[ 3.5% - 4.0% ] 3.74% | 248,036 | 83.8% |
[ 3.5% - 4.0% ] 3.92% | 28,885 | 87.4% |
[ 4.0% - 4.5% ] 4.04% | 226,901 | 76.0% |
[ 4.0% - 4.5% ] 4.19% | 83,204 | 86.1% |
[ 4.0% - 4.5% ] 4.32% | 27,211 | 86.5% |
[ 4.0% - 4.5% ] 4.48% | 182,702 | 69.4% |
[ 4.5% - 5.0% ] 4.62% | 217,878 | 81.9% |
[ 4.5% - 5.0% ] 4.76% | 77,760 | 87.9% |
[ 4.5% - 5.0% ] 4.85% | 69,443 | 82.5% |
[ 5.0% - 5.5% ] 5.04% | 98,715 | 84.0% |
[ 5.0% - 5.5% ] 5.22% | 72,562 | 86.2% |
[ 5.0% - 5.5% ] 5.31% | 3,088 | 94.0% |
[ 5.0% - 5.5% ] 5.43% | 72,450 | 84.2% |
[ 5.5% - 6.0% ] 5.58% | 11,743 | 92.5% |
[ 5.5% - 6.0% ] 5.85% | 29,593 | 87.0% |
[ 5.5% - 6.0% ] 5.99% | 10,133 | 84.4% |
[ 6.0% - 6.5% ] 6.19% | 182,097 | 75.5% |
[ 6.0% - 6.5% ] 6.29% | 47,848 | 74.3% |
[ 6.0% - 6.5% ] 6.46% | 12,421 | 86.0% |
[ 6.5% - 7.0% ] 6.61% | 2,815 | 94.9% |
[ 6.5% - 7.0% ] 6.76% | 47,290 | 81.9% |
[ 6.5% - 7.0% ] 6.90% | 12,868 | 92.4% |
[ 7.0% - 7.5% ] 7.00% | 7,212 | 88.0% |
[ 7.0% - 7.5% ] 7.11% | 17,048 | 78.0% |
[ 7.0% - 7.5% ] 7.27% | 4,967 | 84.5% |
[ 7.0% - 7.5% ] 7.40% | 9,320 | 84.5% |
[ 7.5% - 8.0% ] 7.57% | 1,308 | 91.8% |
[ 7.5% - 8.0% ] 7.70% | 40,263 | 81.2% |
[ 7.5% - 8.0% ] 7.89% | 38,572 | 81.6% |
[ 8.0% - 8.5% ] 8.06% | 29,533 | 83.0% |
[ 8.0% - 8.5% ] 8.11% | 4,523 | 83.8% |
[ 8.0% - 8.5% ] 8.29% | 1,231 | 90.9% |
[ 8.0% - 8.5% ] 8.43% | 522 | 87.2% |
[ 8.5% - 9.0% ] 8.60% | 605 | 97.1% |
[ 8.5% - 9.0% ] 8.89% | 2,463 | 87.2% |
[ 9.0% - 9.5% ] 9.16% | 3,528 | 73.3% |
[ 9.0% - 9.5% ] 9.34% | 22,377 | 75.4% |
[ 9.5% - 10.0% ] 9.51% | 568 | 97.9% |
[ 9.5% - 10.0% ] 9.62% | 82,314 | 80.9% |
[ 9.5% - 10.0% ] 9.71% | 6,847 | 73.8% |
[ 10.0% - 10.5% ] 10.02% | 1,298 | 90.2% |
[ 10.0% - 10.5% ] 10.28% | 1,848 | 82.1% |
[ 10.5% - 11.0% ] 10.87% | 276 | 100.0% |
[ 11.0% - 11.5% ] 11.02% | 581 | 91.5% |
[ 11.0% - 11.5% ] 11.46% | 253 | 88.0% |
[ 11.5% - 12.0% ] 11.77% | 11,069 | 76.1% |
[ 11.5% - 12.0% ] 11.91% | 2,334 | 98.9% |
[ 12.0% - 12.5% ] 12.13% | 5,778 | 88.6% |
[ 12.0% - 12.5% ] 12.27% | 2,910 | 90.2% |
[ 13.0% - 13.5% ] 13.21% | 106 | 85.5% |
[ 13.5% - 14.0% ] 13.73% | 408 | 66.4% |
[ 14.0% - 14.5% ] 14.04% | 57 | 76.2% |
[ 14.0% - 14.5% ] 14.08% | 6,299 | 83.0% |
[ 14.5% - 15.0% ] 14.60% | 815 | 86.5% |
[ 15.5% - 16.0% ] 15.98% | 1,214 | 89.1% |
[ 16.0% - 16.5% ] 16.33% | 98 | 91.7% |
[ 16.5% - 17.0% ] 16.84% | 1,562 | 87.1% |
[ 22.0% - 22.5% ] 22.45% | 196 | 83.2% |
[ 28.0% - 28.5% ] 28.38% | 303 | 96.8% |
[ 69.0% - 69.5% ] 69.30% | 114 | 68.2% |