Immigrants from England vs U.S. Virgin Islander 4 or more Vehicles in Household

COMPARE

Immigrants from England
Race
Ancestry
AfghanAfricanAlaska NativeAlaskan AthabascanAlbanianAleutAlsatianAmericanApacheArabArapahoArgentineanArmenianAssyrian/Chaldean/SyriacAustralianAustrianBahamianBangladeshiBarbadianBasqueBelgianBelizeanBermudanBhutaneseBlackfeetBolivianBrazilianBritishBritish West IndianBulgarianBurmeseCajunCambodianCanadianCape VerdeanCarpatho RusynCelticCentral AmericanCentral American IndianCherokeeCheyenneChickasawChileanChineseChippewaChoctawColombianColvilleComancheCosta RicanCreeCreekCroatianCrowCubanCypriotCzechCzechoslovakianDanishDelawareDominicanDutchDutch West IndianEastern EuropeanEcuadorianEgyptianEnglishEstonianEthiopianEuropeanFijianFilipinoFinnishFrenchFrench American IndianFrench CanadianGermanGerman RussianGhanaianGreekGuamanian/ChamorroGuatemalanGuyaneseHaitianHmongHonduranHopiHoumaHungarianIcelanderIndian (Asian)IndonesianInupiatIranianIraqiIrishIroquoisIsraeliItalianJamaicanJapaneseJordanianKenyanKiowaKoreanLaotianLatvianLebaneseLiberianLithuanianLumbeeLuxembourgerMacedonianMalaysianMalteseMarshalleseMenomineeMexicanMexican American IndianMongolianMoroccanNative HawaiianNavajoNepaleseNew ZealanderNicaraguanNigerianNorthern EuropeanNorwegianOkinawanOsageOttawaPaiutePakistaniPalestinianPanamanianParaguayanPennsylvania GermanPeruvianPimaPolishPortuguesePotawatomiPuebloPuerto RicanPuget Sound SalishRomanianRussianSalvadoranSamoanScandinavianScotch-IrishScottishSeminoleSenegaleseSerbianShoshoneSierra LeoneanSiouxSlavicSlovakSloveneSomaliSouth AfricanSouth AmericanSouth American IndianSoviet UnionSpaniardSpanishSpanish AmericanSpanish American IndianSri LankanSubsaharan AfricanSudaneseSwedishSwissSyrianTaiwaneseThaiTlingit-HaidaTohono O'OdhamTonganTrinidadian and TobagonianTsimshianTurkishUgandanUkrainianUruguayanUteVenezuelanVietnameseWelshWest IndianYakamaYaquiYugoslavianYumanYup'ikZimbabwean
Immigration
NonimmigrantsImmigrantsAfghanistanAfricaAlbaniaArgentinaArmeniaAsiaAustraliaAustriaBahamasBangladeshBarbadosBelarusBelgiumBelizeBoliviaBosnia and HerzegovinaBrazilBulgariaBurma/MyanmarCabo VerdeCambodiaCameroonCanadaCaribbeanCentral AmericaChileChinaColombiaCongoCosta RicaCroatiaCubaCzechoslovakiaDenmarkDominicaDominican RepublicEastern AfricaEastern AsiaEastern EuropeEcuadorEgyptEl SalvadorEnglandEritreaEthiopiaEuropeFijiFranceGermanyGhanaGreeceGrenadaGuatemalaGuyanaHaitiHondurasHong KongHungaryIndiaIndonesiaIranIraqIrelandIsraelItalyJamaicaJapanJordanKazakhstanKenyaKoreaKuwaitLaosLatin AmericaLatviaLebanonLiberiaLithuaniaMalaysiaMexicoMicronesiaMiddle AfricaMoldovaMoroccoNepalNetherlandsNicaraguaNigeriaNorth AmericaNorth MacedoniaNorthern AfricaNorthern EuropeNorwayOceaniaPakistanPanamaPeruPhilippinesPolandPortugalRomaniaRussiaSaudi ArabiaScotlandSenegalSerbiaSierra LeoneSingaporeSomaliaSouth AfricaSouth AmericaSouth Central AsiaSouth Eastern AsiaSouthern EuropeSpainSri LankaSt. Vincent and the GrenadinesSudanSwedenSwitzerlandSyriaTaiwanThailandTrinidad and TobagoTurkeyUgandaUkraineUruguayUzbekistanVenezuelaVietnamWest IndiesWestern AfricaWestern AsiaWestern EuropeYemenZaireZimbabweAzores
U.S. Virgin Islander
Race
Ancestry
AfghanAfricanAlaska NativeAlaskan AthabascanAlbanianAleutAlsatianAmericanApacheArabArapahoArgentineanArmenianAssyrian/Chaldean/SyriacAustralianAustrianBahamianBangladeshiBarbadianBasqueBelgianBelizeanBermudanBhutaneseBlackfeetBolivianBrazilianBritishBritish West IndianBulgarianBurmeseCajunCambodianCanadianCape VerdeanCarpatho RusynCelticCentral AmericanCentral American IndianCherokeeCheyenneChickasawChileanChineseChippewaChoctawColombianColvilleComancheCosta RicanCreeCreekCroatianCrowCubanCypriotCzechCzechoslovakianDanishDelawareDominicanDutchDutch West IndianEastern EuropeanEcuadorianEgyptianEnglishEstonianEthiopianEuropeanFijianFilipinoFinnishFrenchFrench American IndianFrench CanadianGermanGerman RussianGhanaianGreekGuamanian/ChamorroGuatemalanGuyaneseHaitianHmongHonduranHopiHoumaHungarianIcelanderIndian (Asian)IndonesianInupiatIranianIraqiIrishIroquoisIsraeliItalianJamaicanJapaneseJordanianKenyanKiowaKoreanLaotianLatvianLebaneseLiberianLithuanianLumbeeLuxembourgerMacedonianMalaysianMalteseMarshalleseMenomineeMexicanMexican American IndianMongolianMoroccanNative HawaiianNavajoNepaleseNew ZealanderNicaraguanNigerianNorthern EuropeanNorwegianOkinawanOsageOttawaPaiutePakistaniPalestinianPanamanianParaguayanPennsylvania GermanPeruvianPimaPolishPortuguesePotawatomiPuebloPuerto RicanPuget Sound SalishRomanianRussianSalvadoranSamoanScandinavianScotch-IrishScottishSeminoleSenegaleseSerbianShoshoneSierra LeoneanSiouxSlavicSlovakSloveneSomaliSouth AfricanSouth AmericanSouth American IndianSoviet UnionSpaniardSpanishSpanish AmericanSpanish American IndianSri LankanSubsaharan AfricanSudaneseSwedishSwissSyrianTaiwaneseThaiTlingit-HaidaTohono O'OdhamTonganTrinidadian and TobagonianTsimshianTurkishU.S. Virgin IslanderUgandanUkrainianUruguayanUteVenezuelanVietnameseWelshWest IndianYakamaYaquiYugoslavianYumanYup'ikZimbabwean
Immigration
NonimmigrantsImmigrantsAfghanistanAfricaAlbaniaArgentinaArmeniaAsiaAustraliaAustriaBahamasBangladeshBarbadosBelarusBelgiumBelizeBoliviaBosnia and HerzegovinaBrazilBulgariaBurma/MyanmarCabo VerdeCambodiaCameroonCanadaCaribbeanCentral AmericaChileChinaColombiaCongoCosta RicaCroatiaCubaCzechoslovakiaDenmarkDominicaDominican RepublicEastern AfricaEastern AsiaEastern EuropeEcuadorEgyptEl SalvadorEritreaEthiopiaEuropeFijiFranceGermanyGhanaGreeceGrenadaGuatemalaGuyanaHaitiHondurasHong KongHungaryIndiaIndonesiaIranIraqIrelandIsraelItalyJamaicaJapanJordanKazakhstanKenyaKoreaKuwaitLaosLatin AmericaLatviaLebanonLiberiaLithuaniaMalaysiaMexicoMicronesiaMiddle AfricaMoldovaMoroccoNepalNetherlandsNicaraguaNigeriaNorth AmericaNorth MacedoniaNorthern AfricaNorthern EuropeNorwayOceaniaPakistanPanamaPeruPhilippinesPolandPortugalRomaniaRussiaSaudi ArabiaScotlandSenegalSerbiaSierra LeoneSingaporeSomaliaSouth AfricaSouth AmericaSouth Central AsiaSouth Eastern AsiaSouthern EuropeSpainSri LankaSt. Vincent and the GrenadinesSudanSwedenSwitzerlandSyriaTaiwanThailandTrinidad and TobagoTurkeyUgandaUkraineUruguayUzbekistanVenezuelaVietnamWest IndiesWestern AfricaWestern AsiaWestern EuropeYemenZaireZimbabweAzores
4 or more Vehicles in Household
Income
Poverty
Unemployment
Labor Participation
Family Structure
Vehicle Availability
Education Level
Disability

4 or more Vehicles in Household Comparison

Immigrants from England

U.S. Virgin Islanders

Exceptional
Tragic
6.7%
4 OR MORE VEHICLES IN HOUSEHOLD
92.0/ 100
METRIC RATING
129th/ 347
METRIC RANK
4.6%
4 OR MORE VEHICLES IN HOUSEHOLD
0.0/ 100
METRIC RATING
317th/ 347
METRIC RANK

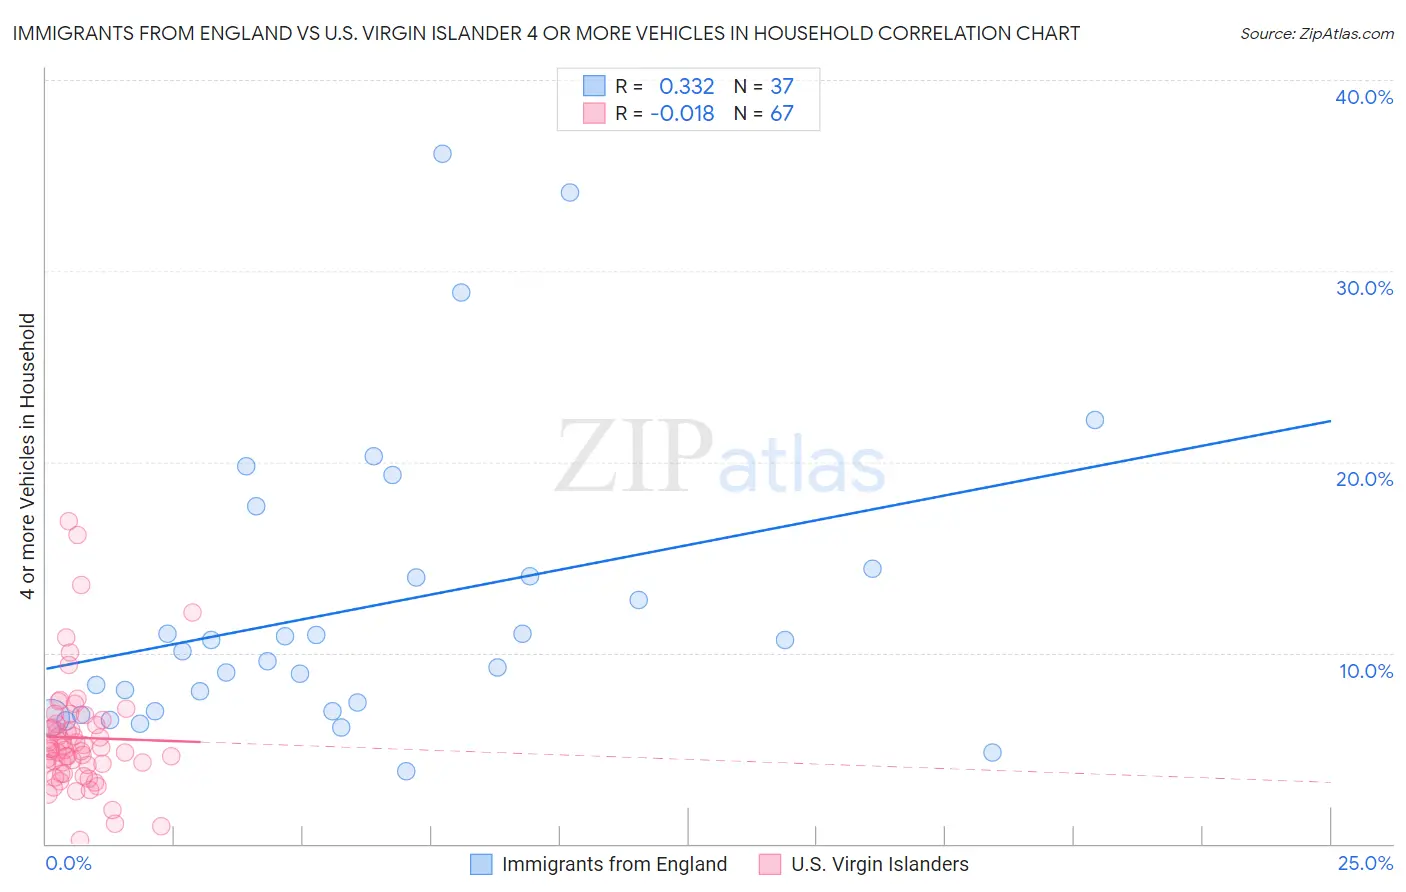
Immigrants from England vs U.S. Virgin Islander 4 or more Vehicles in Household Correlation Chart

The statistical analysis conducted on geographies consisting of 390,499,867 people shows a mild positive correlation between the proportion of Immigrants from England and percentage of households with 4 or more vehicles available in the United States with a correlation coefficient (R) of 0.332 and weighted average of 6.7%. Similarly, the statistical analysis conducted on geographies consisting of 87,207,044 people shows no correlation between the proportion of U.S. Virgin Islanders and percentage of households with 4 or more vehicles available in the United States with a correlation coefficient (R) of -0.018 and weighted average of 4.6%, a difference of 44.7%.
Immigrants from England vs U.S. Virgin Islander 4 or more Vehicles in Household

4 or more Vehicles in Household Correlation Summary

MeasurementImmigrants from EnglandU.S. Virgin Islander
Minimum3.8%0.17%
Maximum36.2%16.9%
Range32.3%16.7%
Mean12.4%5.6%
Median10.1%5.0%
Interquartile 25% (IQ1)6.9%4.2%
Interquartile 75% (IQ3)14.2%6.3%
Interquartile Range (IQR)7.3%2.1%
Standard Deviation (Sample)7.7%3.0%
Standard Deviation (Population)7.6%3.0%

Similar Demographics by 4 or more Vehicles in Household

Demographics Similar to Immigrants from England by 4 or more Vehicles in Household

In terms of 4 or more vehicles in household, the demographic groups most similar to Immigrants from England are Immigrants from Bolivia (6.7%, a difference of 0.16%), Immigrants from Korea (6.8%, a difference of 0.66%), Austrian (6.8%, a difference of 0.79%), Belgian (6.8%, a difference of 0.79%), and Immigrants from Scotland (6.7%, a difference of 0.83%).
DemographicsRating | Rank4 or more Vehicles in Household
Immigrants | Nicaragua
94.7
/100
|
#122
Exceptional
6.8%
Immigrants | Immigrants
94.6
/100
|
#123
Exceptional
6.8%
Immigrants | Asia
94.4
/100
|
#124
Exceptional
6.8%
Austrians
94.1
/100
|
#125
Exceptional
6.8%
Belgians
94.1
/100
|
#126
Exceptional
6.8%
Immigrants | Korea
93.8
/100
|
#127
Exceptional
6.8%
Immigrants | Bolivia
92.5
/100
|
#128
Exceptional
6.7%
Immigrants | England
92.0
/100
|
#129
Exceptional
6.7%
Immigrants | Scotland
89.0
/100
|
#130
Excellent
6.7%
Maltese
88.4
/100
|
#131
Excellent
6.7%
Immigrants | Netherlands
87.8
/100
|
#132
Excellent
6.6%
Armenians
86.9
/100
|
#133
Excellent
6.6%
Ottawa
86.9
/100
|
#134
Excellent
6.6%
Tohono O'odham
86.7
/100
|
#135
Excellent
6.6%
Luxembourgers
86.4
/100
|
#136
Excellent
6.6%

Demographics Similar to U.S. Virgin Islanders by 4 or more Vehicles in Household

In terms of 4 or more vehicles in household, the demographic groups most similar to U.S. Virgin Islanders are Jamaican (4.6%, a difference of 0.24%), Haitian (4.6%, a difference of 0.89%), Puerto Rican (4.7%, a difference of 1.7%), Immigrants from Belarus (4.7%, a difference of 2.1%), and Immigrants from West Indies (4.7%, a difference of 2.2%).
DemographicsRating | Rank4 or more Vehicles in Household
Moroccans
0.0
/100
|
#310
Tragic
4.9%
Houma
0.0
/100
|
#311
Tragic
4.9%
Albanians
0.0
/100
|
#312
Tragic
4.8%
Immigrants | Israel
0.0
/100
|
#313
Tragic
4.8%
Immigrants | West Indies
0.0
/100
|
#314
Tragic
4.7%
Immigrants | Belarus
0.0
/100
|
#315
Tragic
4.7%
Puerto Ricans
0.0
/100
|
#316
Tragic
4.7%
U.S. Virgin Islanders
0.0
/100
|
#317
Tragic
4.6%
Jamaicans
0.0
/100
|
#318
Tragic
4.6%
Haitians
0.0
/100
|
#319
Tragic
4.6%
Immigrants | Haiti
0.0
/100
|
#320
Tragic
4.5%
Ecuadorians
0.0
/100
|
#321
Tragic
4.5%
Immigrants | Yemen
0.0
/100
|
#322
Tragic
4.5%
Immigrants | Caribbean
0.0
/100
|
#323
Tragic
4.4%
Soviet Union
0.0
/100
|
#324
Tragic
4.4%