Armenian Disability
COMPARE
Armenian
Select to Compare
Disability
Armenian Disability
11.6%
DISABILITY
65.9/ 100
METRIC RATING
158th/ 347
METRIC RANK
Armenian Disability Correlation Chart
The statistical analysis conducted on geographies consisting of 310,943,195 people shows a significant positive correlation between the proportion of Armenians and percentage of population with a disability in the United States with a correlation coefficient (R) of 0.679 and weighted average of 11.6%. On average, for every 1% (one percent) increase in Armenians within a typical geography, there is an increase of 0.49% in percentage of population with a disability.
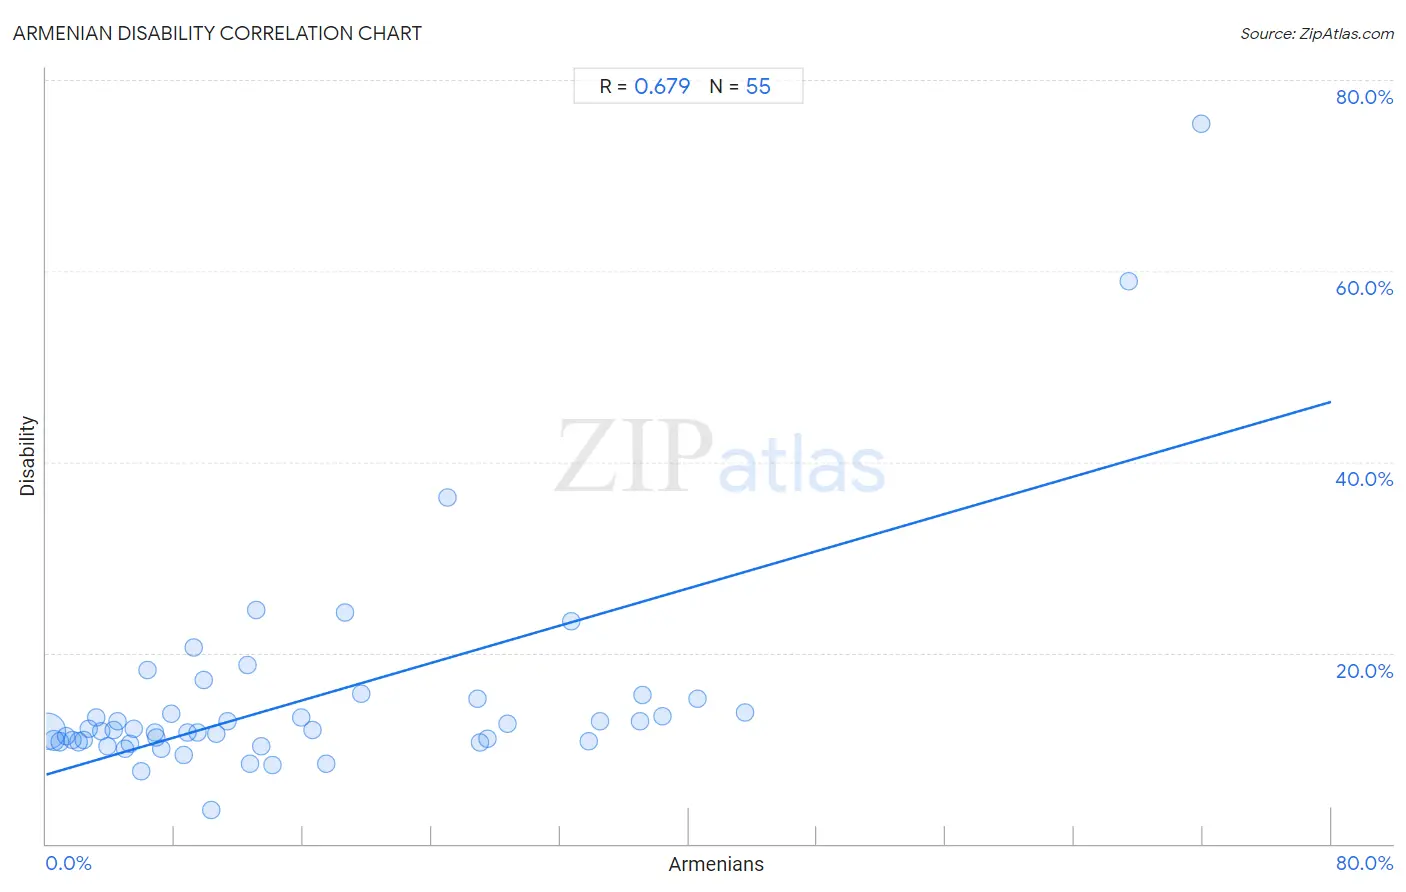
It is essential to understand that the correlation between the percentage of Armenians and percentage of population with a disability does not imply a direct cause-and-effect relationship. It remains uncertain whether the presence of Armenians influences an upward or downward trend in the level of percentage of population with a disability within an area, or if Armenians simply ended up residing in those areas with higher or lower levels of percentage of population with a disability due to other factors.
Demographics Similar to Armenians by Disability
In terms of disability, the demographic groups most similar to Armenians are Guatemalan (11.6%, a difference of 0.040%), Immigrants from Barbados (11.6%, a difference of 0.080%), Immigrants from Cuba (11.6%, a difference of 0.15%), Immigrants from Middle Africa (11.6%, a difference of 0.18%), and Immigrants from Fiji (11.6%, a difference of 0.19%).
| Demographics | Rating | Rank | Disability |
| Immigrants from Kenya | 72.1 /100 | #151 | Good 11.6% |
| Immigrants from Moldova | 72.0 /100 | #152 | Good 11.6% |
| Immigrants from Ghana | 71.2 /100 | #153 | Good 11.6% |
| Immigrants from Guatemala | 71.1 /100 | #154 | Good 11.6% |
| Immigrants from Netherlands | 69.8 /100 | #155 | Good 11.6% |
| Immigrants from Fiji | 69.5 /100 | #156 | Good 11.6% |
| Immigrants from Middle Africa | 69.5 /100 | #157 | Good 11.6% |
| Armenians | 65.9 /100 | #158 | Good 11.6% |
| Guatemalans | 65.1 /100 | #159 | Good 11.6% |
| Immigrants from Barbados | 64.2 /100 | #160 | Good 11.6% |
| Immigrants from Cuba | 62.8 /100 | #161 | Good 11.6% |
| Immigrants from Haiti | 59.2 /100 | #162 | Average 11.7% |
| Immigrants from Trinidad and Tobago | 58.9 /100 | #163 | Average 11.7% |
| Syrians | 58.5 /100 | #164 | Average 11.7% |
| Cubans | 56.7 /100 | #165 | Average 11.7% |
Armenian Disability Correlation Summary
| Measurement | Armenian Data | Disability Data |
| Minimum | 0.098% | 3.6% |
| Maximum | 71.9% | 75.4% |
| Range | 71.8% | 71.8% |
| Mean | 16.2% | 15.1% |
| Median | 10.3% | 11.9% |
| Interquartile 25% (IQ1) | 4.9% | 10.7% |
| Interquartile 75% (IQ3) | 26.8% | 15.1% |
| Interquartile Range (IQR) | 22.0% | 4.4% |
| Standard Deviation (Sample) | 16.0% | 11.5% |
| Standard Deviation (Population) | 15.8% | 11.4% |
Correlation Details
| Armenian Percentile | Sample Size | Disability |
[ 0.0% - 0.5% ] 0.098% | 270,319,420 | 11.7% |
[ 0.0% - 0.5% ] 0.49% | 23,689,658 | 10.8% |
[ 0.5% - 1.0% ] 0.87% | 5,376,356 | 10.7% |
[ 1.0% - 1.5% ] 1.24% | 2,947,229 | 11.2% |
[ 1.5% - 2.0% ] 1.62% | 855,493 | 10.8% |
[ 2.0% - 2.5% ] 2.02% | 4,863,084 | 10.7% |
[ 2.0% - 2.5% ] 2.30% | 517,023 | 10.9% |
[ 2.5% - 3.0% ] 2.68% | 505,109 | 12.1% |
[ 3.0% - 3.5% ] 3.12% | 111,744 | 13.2% |
[ 3.0% - 3.5% ] 3.45% | 259,339 | 11.8% |
[ 3.5% - 4.0% ] 3.83% | 26,366 | 10.3% |
[ 4.0% - 4.5% ] 4.18% | 69,517 | 11.9% |
[ 4.0% - 4.5% ] 4.45% | 111,981 | 12.8% |
[ 4.5% - 5.0% ] 4.87% | 31,277 | 10.0% |
[ 5.0% - 5.5% ] 5.22% | 90,874 | 10.5% |
[ 5.0% - 5.5% ] 5.46% | 109,756 | 12.1% |
[ 5.5% - 6.0% ] 5.90% | 88,797 | 7.5% |
[ 6.0% - 6.5% ] 6.27% | 829 | 18.2% |
[ 6.5% - 7.0% ] 6.80% | 60,345 | 11.6% |
[ 6.5% - 7.0% ] 6.86% | 44,244 | 11.2% |
[ 7.0% - 7.5% ] 7.19% | 20,092 | 10.0% |
[ 7.5% - 8.0% ] 7.76% | 7,344 | 13.6% |
[ 8.5% - 9.0% ] 8.54% | 72,421 | 9.3% |
[ 8.5% - 9.0% ] 8.76% | 145,227 | 11.6% |
[ 9.0% - 9.5% ] 9.19% | 468 | 20.5% |
[ 9.0% - 9.5% ] 9.42% | 43,893 | 11.7% |
[ 9.5% - 10.0% ] 9.80% | 1,204 | 17.1% |
[ 10.0% - 10.5% ] 10.27% | 224 | 3.6% |
[ 10.5% - 11.0% ] 10.62% | 51,654 | 11.5% |
[ 11.0% - 11.5% ] 11.28% | 133 | 12.8% |
[ 12.0% - 12.5% ] 12.50% | 16 | 18.8% |
[ 12.5% - 13.0% ] 12.69% | 33,101 | 8.4% |
[ 13.0% - 13.5% ] 13.08% | 650 | 24.5% |
[ 13.0% - 13.5% ] 13.41% | 27,523 | 10.2% |
[ 14.0% - 14.5% ] 14.08% | 206 | 8.3% |
[ 15.5% - 16.0% ] 15.89% | 2,644 | 13.2% |
[ 16.5% - 17.0% ] 16.58% | 20,911 | 11.9% |
[ 17.0% - 17.5% ] 17.46% | 8,209 | 8.4% |
[ 18.5% - 19.0% ] 18.64% | 499 | 24.2% |
[ 19.5% - 20.0% ] 19.65% | 12,312 | 15.7% |
[ 25.0% - 25.5% ] 25.00% | 116 | 36.2% |
[ 26.5% - 27.0% ] 26.83% | 45,564 | 15.2% |
[ 26.5% - 27.0% ] 26.98% | 15,465 | 10.7% |
[ 27.0% - 27.5% ] 27.43% | 226 | 11.1% |
[ 28.5% - 29.0% ] 28.71% | 18,951 | 12.5% |
[ 32.5% - 33.0% ] 32.71% | 107 | 23.4% |
[ 33.5% - 34.0% ] 33.78% | 16,679 | 10.7% |
[ 34.5% - 35.0% ] 34.51% | 194,512 | 12.8% |
[ 36.5% - 37.0% ] 36.93% | 32,294 | 12.8% |
[ 37.0% - 37.5% ] 37.12% | 35,755 | 15.6% |
[ 38.0% - 38.5% ] 38.33% | 11,091 | 13.3% |
[ 40.5% - 41.0% ] 40.51% | 22,831 | 15.1% |
[ 43.5% - 44.0% ] 43.52% | 22,163 | 13.8% |
[ 67.0% - 67.5% ] 67.38% | 141 | 58.9% |
[ 71.5% - 72.0% ] 71.88% | 128 | 75.4% |