Armenian College, Under 1 year
COMPARE
Armenian
Select to Compare
College, Under 1 year
Armenian College, Under 1 year
68.1%
COLLEGE, UNDER 1 YEAR
97.7/ 100
METRIC RATING
94th/ 347
METRIC RANK
Armenian College, Under 1 year Correlation Chart
The statistical analysis conducted on geographies consisting of 310,952,332 people shows a poor negative correlation between the proportion of Armenians and percentage of population with at least college, under 1 year education in the United States with a correlation coefficient (R) of -0.100 and weighted average of 68.1%. On average, for every 1% (one percent) increase in Armenians within a typical geography, there is a decrease of 0.084% in percentage of population with at least college, under 1 year education.
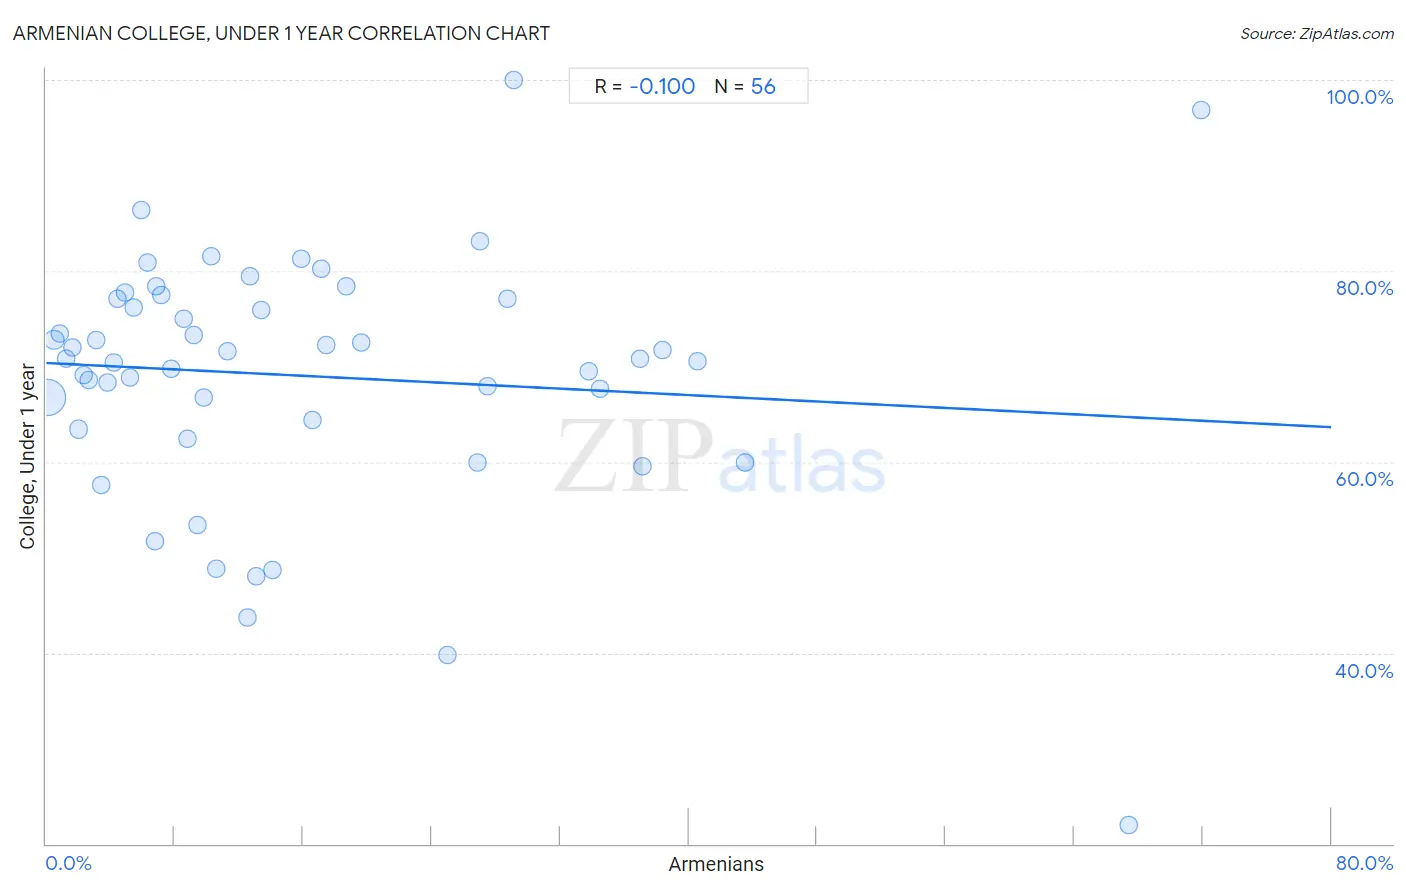
It is essential to understand that the correlation between the percentage of Armenians and percentage of population with at least college, under 1 year education does not imply a direct cause-and-effect relationship. It remains uncertain whether the presence of Armenians influences an upward or downward trend in the level of percentage of population with at least college, under 1 year education within an area, or if Armenians simply ended up residing in those areas with higher or lower levels of percentage of population with at least college, under 1 year education due to other factors.
Demographics Similar to Armenians by College, Under 1 year
In terms of college, under 1 year, the demographic groups most similar to Armenians are Romanian (68.2%, a difference of 0.090%), Immigrants from Pakistan (68.0%, a difference of 0.090%), Jordanian (68.0%, a difference of 0.13%), Immigrants from Ethiopia (68.0%, a difference of 0.15%), and Luxembourger (68.2%, a difference of 0.19%).
| Demographics | Rating | Rank | College, Under 1 year |
| Chinese | 98.3 /100 | #87 | Exceptional 68.3% |
| Croatians | 98.2 /100 | #88 | Exceptional 68.3% |
| Ethiopians | 98.2 /100 | #89 | Exceptional 68.3% |
| Icelanders | 98.1 /100 | #90 | Exceptional 68.3% |
| Europeans | 98.1 /100 | #91 | Exceptional 68.2% |
| Luxembourgers | 98.1 /100 | #92 | Exceptional 68.2% |
| Romanians | 97.9 /100 | #93 | Exceptional 68.2% |
| Armenians | 97.7 /100 | #94 | Exceptional 68.1% |
| Immigrants from Pakistan | 97.5 /100 | #95 | Exceptional 68.0% |
| Jordanians | 97.4 /100 | #96 | Exceptional 68.0% |
| Immigrants from Ethiopia | 97.3 /100 | #97 | Exceptional 68.0% |
| Paraguayans | 97.1 /100 | #98 | Exceptional 67.9% |
| Immigrants from Bolivia | 97.0 /100 | #99 | Exceptional 67.9% |
| Immigrants from Argentina | 97.0 /100 | #100 | Exceptional 67.9% |
| Immigrants from Eastern Europe | 96.9 /100 | #101 | Exceptional 67.9% |
Armenian College, Under 1 year Correlation Summary
| Measurement | Armenian Data | College, Under 1 year Data |
| Minimum | 0.098% | 22.0% |
| Maximum | 71.9% | 100.0% |
| Range | 71.8% | 78.0% |
| Mean | 16.1% | 69.0% |
| Median | 10.4% | 70.8% |
| Interquartile 25% (IQ1) | 5.0% | 63.9% |
| Interquartile 75% (IQ3) | 25.9% | 77.1% |
| Interquartile Range (IQR) | 20.9% | 13.2% |
| Standard Deviation (Sample) | 15.7% | 13.2% |
| Standard Deviation (Population) | 15.6% | 13.1% |
Correlation Details
| Armenian Percentile | Sample Size | College, Under 1 year |
[ 0.0% - 0.5% ] 0.098% | 270,322,147 | 66.7% |
[ 0.0% - 0.5% ] 0.49% | 23,694,600 | 72.8% |
[ 0.5% - 1.0% ] 0.87% | 5,377,520 | 73.5% |
[ 1.0% - 1.5% ] 1.24% | 2,947,229 | 70.9% |
[ 1.5% - 2.0% ] 1.62% | 855,493 | 72.0% |
[ 2.0% - 2.5% ] 2.02% | 4,862,028 | 63.4% |
[ 2.0% - 2.5% ] 2.30% | 516,622 | 69.1% |
[ 2.5% - 3.0% ] 2.68% | 506,551 | 68.5% |
[ 3.0% - 3.5% ] 3.12% | 111,744 | 72.7% |
[ 3.0% - 3.5% ] 3.45% | 259,462 | 57.5% |
[ 3.5% - 4.0% ] 3.83% | 26,366 | 68.3% |
[ 4.0% - 4.5% ] 4.18% | 69,517 | 70.5% |
[ 4.0% - 4.5% ] 4.45% | 112,165 | 77.1% |
[ 4.5% - 5.0% ] 4.87% | 31,277 | 77.8% |
[ 5.0% - 5.5% ] 5.22% | 90,874 | 68.8% |
[ 5.0% - 5.5% ] 5.46% | 109,756 | 76.2% |
[ 5.5% - 6.0% ] 5.90% | 88,797 | 86.4% |
[ 6.0% - 6.5% ] 6.27% | 829 | 80.9% |
[ 6.5% - 7.0% ] 6.80% | 60,345 | 51.7% |
[ 6.5% - 7.0% ] 6.86% | 44,244 | 78.4% |
[ 7.0% - 7.5% ] 7.19% | 20,092 | 77.5% |
[ 7.5% - 8.0% ] 7.76% | 7,344 | 69.8% |
[ 8.5% - 9.0% ] 8.54% | 72,421 | 75.0% |
[ 8.5% - 9.0% ] 8.76% | 145,227 | 62.5% |
[ 9.0% - 9.5% ] 9.19% | 468 | 73.3% |
[ 9.0% - 9.5% ] 9.41% | 43,552 | 53.4% |
[ 9.5% - 10.0% ] 9.80% | 1,204 | 66.7% |
[ 10.0% - 10.5% ] 10.27% | 224 | 81.5% |
[ 10.5% - 11.0% ] 10.62% | 51,654 | 48.8% |
[ 11.0% - 11.5% ] 11.28% | 133 | 71.6% |
[ 12.0% - 12.5% ] 12.50% | 16 | 43.8% |
[ 12.5% - 13.0% ] 12.69% | 33,163 | 79.4% |
[ 13.0% - 13.5% ] 13.08% | 650 | 48.0% |
[ 13.0% - 13.5% ] 13.41% | 27,523 | 75.9% |
[ 14.0% - 14.5% ] 14.08% | 206 | 48.7% |
[ 15.5% - 16.0% ] 15.89% | 2,644 | 81.2% |
[ 16.5% - 17.0% ] 16.58% | 20,911 | 64.4% |
[ 17.0% - 17.5% ] 17.10% | 310 | 80.2% |
[ 17.0% - 17.5% ] 17.46% | 8,209 | 72.2% |
[ 18.5% - 19.0% ] 18.65% | 429 | 78.4% |
[ 19.5% - 20.0% ] 19.65% | 12,312 | 72.4% |
[ 25.0% - 25.5% ] 25.00% | 116 | 39.8% |
[ 26.5% - 27.0% ] 26.83% | 45,564 | 60.0% |
[ 26.5% - 27.0% ] 26.98% | 15,465 | 83.1% |
[ 27.0% - 27.5% ] 27.43% | 226 | 67.9% |
[ 28.5% - 29.0% ] 28.71% | 18,951 | 77.0% |
[ 29.0% - 29.5% ] 29.11% | 158 | 100.0% |
[ 33.5% - 34.0% ] 33.78% | 16,679 | 69.5% |
[ 34.5% - 35.0% ] 34.51% | 194,512 | 67.7% |
[ 36.5% - 37.0% ] 36.93% | 32,294 | 70.8% |
[ 37.0% - 37.5% ] 37.12% | 35,755 | 59.5% |
[ 38.0% - 38.5% ] 38.33% | 11,091 | 71.7% |
[ 40.5% - 41.0% ] 40.51% | 22,831 | 70.6% |
[ 43.5% - 44.0% ] 43.52% | 22,163 | 60.0% |
[ 67.0% - 67.5% ] 67.38% | 141 | 22.0% |
[ 71.5% - 72.0% ] 71.88% | 128 | 96.9% |