Armenian Married-Couple Family Poverty

COMPARE

Armenian
Race
Ancestry
AfghanAfricanAlaska NativeAlaskan AthabascanAlbanianAleutAlsatianAmericanApacheArabArapahoArgentineanArmenianAssyrian/Chaldean/SyriacAustralianAustrianBahamianBangladeshiBarbadianBasqueBelgianBelizeanBermudanBhutaneseBlackfeetBolivianBrazilianBritishBritish West IndianBulgarianBurmeseCajunCambodianCanadianCape VerdeanCarpatho RusynCelticCentral AmericanCentral American IndianCherokeeCheyenneChickasawChileanChineseChippewaChoctawColombianColvilleComancheCosta RicanCreeCreekCroatianCrowCubanCypriotCzechCzechoslovakianDanishDelawareDominicanDutchDutch West IndianEastern EuropeanEcuadorianEgyptianEnglishEstonianEthiopianEuropeanFijianFilipinoFinnishFrenchFrench American IndianFrench CanadianGermanGerman RussianGhanaianGreekGuamanian/ChamorroGuatemalanGuyaneseHaitianHmongHonduranHopiHoumaHungarianIcelanderIndian (Asian)IndonesianInupiatIranianIraqiIrishIroquoisIsraeliItalianJamaicanJapaneseJordanianKenyanKiowaKoreanLaotianLatvianLebaneseLiberianLithuanianLumbeeLuxembourgerMacedonianMalaysianMalteseMarshalleseMenomineeMexicanMexican American IndianMongolianMoroccanNative HawaiianNavajoNepaleseNew ZealanderNicaraguanNigerianNorthern EuropeanNorwegianOkinawanOsageOttawaPaiutePakistaniPalestinianPanamanianParaguayanPennsylvania GermanPeruvianPimaPolishPortuguesePotawatomiPuebloPuerto RicanPuget Sound SalishRomanianRussianSalvadoranSamoanScandinavianScotch-IrishScottishSeminoleSenegaleseSerbianShoshoneSierra LeoneanSiouxSlavicSlovakSloveneSomaliSouth AfricanSouth AmericanSouth American IndianSoviet UnionSpaniardSpanishSpanish AmericanSpanish American IndianSri LankanSubsaharan AfricanSudaneseSwedishSwissSyrianTaiwaneseThaiTlingit-HaidaTohono O'OdhamTonganTrinidadian and TobagonianTsimshianTurkishU.S. Virgin IslanderUgandanUkrainianUruguayanUteVenezuelanVietnameseWelshWest IndianYakamaYaquiYugoslavianYumanYup'ikZimbabwean
Immigration
NonimmigrantsImmigrantsAfghanistanAfricaAlbaniaArgentinaArmeniaAsiaAustraliaAustriaBahamasBangladeshBarbadosBelarusBelgiumBelizeBoliviaBosnia and HerzegovinaBrazilBulgariaBurma/MyanmarCabo VerdeCambodiaCameroonCanadaCaribbeanCentral AmericaChileChinaColombiaCongoCosta RicaCroatiaCubaCzechoslovakiaDenmarkDominicaDominican RepublicEastern AfricaEastern AsiaEastern EuropeEcuadorEgyptEl SalvadorEnglandEritreaEthiopiaEuropeFijiFranceGermanyGhanaGreeceGrenadaGuatemalaGuyanaHaitiHondurasHong KongHungaryIndiaIndonesiaIranIraqIrelandIsraelItalyJamaicaJapanJordanKazakhstanKenyaKoreaKuwaitLaosLatin AmericaLatviaLebanonLiberiaLithuaniaMalaysiaMexicoMicronesiaMiddle AfricaMoldovaMoroccoNepalNetherlandsNicaraguaNigeriaNorth AmericaNorth MacedoniaNorthern AfricaNorthern EuropeNorwayOceaniaPakistanPanamaPeruPhilippinesPolandPortugalRomaniaRussiaSaudi ArabiaScotlandSenegalSerbiaSierra LeoneSingaporeSomaliaSouth AfricaSouth AmericaSouth Central AsiaSouth Eastern AsiaSouthern EuropeSpainSri LankaSt. Vincent and the GrenadinesSudanSwedenSwitzerlandSyriaTaiwanThailandTrinidad and TobagoTurkeyUgandaUkraineUruguayUzbekistanVenezuelaVietnamWest IndiesWestern AfricaWestern AsiaWestern EuropeYemenZaireZimbabweAzores
Select to Compare
Race
Ancestry
AfghanAfricanAlaska NativeAlaskan AthabascanAlbanianAleutAlsatianAmericanApacheArabArapahoArgentineanAssyrian/Chaldean/SyriacAustralianAustrianBahamianBangladeshiBarbadianBasqueBelgianBelizeanBermudanBhutaneseBlackfeetBolivianBrazilianBritishBritish West IndianBulgarianBurmeseCajunCambodianCanadianCape VerdeanCarpatho RusynCelticCentral AmericanCentral American IndianCherokeeCheyenneChickasawChileanChineseChippewaChoctawColombianColvilleComancheCosta RicanCreeCreekCroatianCrowCubanCypriotCzechCzechoslovakianDanishDelawareDominicanDutchDutch West IndianEastern EuropeanEcuadorianEgyptianEnglishEstonianEthiopianEuropeanFijianFilipinoFinnishFrenchFrench American IndianFrench CanadianGermanGerman RussianGhanaianGreekGuamanian/ChamorroGuatemalanGuyaneseHaitianHmongHonduranHopiHoumaHungarianIcelanderIndian (Asian)IndonesianInupiatIranianIraqiIrishIroquoisIsraeliItalianJamaicanJapaneseJordanianKenyanKiowaKoreanLaotianLatvianLebaneseLiberianLithuanianLumbeeLuxembourgerMacedonianMalaysianMalteseMarshalleseMenomineeMexicanMexican American IndianMongolianMoroccanNative HawaiianNavajoNepaleseNew ZealanderNicaraguanNigerianNorthern EuropeanNorwegianOkinawanOsageOttawaPaiutePakistaniPalestinianPanamanianParaguayanPennsylvania GermanPeruvianPimaPolishPortuguesePotawatomiPuebloPuerto RicanPuget Sound SalishRomanianRussianSalvadoranSamoanScandinavianScotch-IrishScottishSeminoleSenegaleseSerbianShoshoneSierra LeoneanSiouxSlavicSlovakSloveneSomaliSouth AfricanSouth AmericanSouth American IndianSoviet UnionSpaniardSpanishSpanish AmericanSpanish American IndianSri LankanSubsaharan AfricanSudaneseSwedishSwissSyrianTaiwaneseThaiTlingit-HaidaTohono O'OdhamTonganTrinidadian and TobagonianTsimshianTurkishU.S. Virgin IslanderUgandanUkrainianUruguayanUteVenezuelanVietnameseWelshWest IndianYakamaYaquiYugoslavianYumanYup'ikZimbabwean
Immigration
NonimmigrantsImmigrantsAfghanistanAfricaAlbaniaArgentinaArmeniaAsiaAustraliaAustriaBahamasBangladeshBarbadosBelarusBelgiumBelizeBoliviaBosnia and HerzegovinaBrazilBulgariaBurma/MyanmarCabo VerdeCambodiaCameroonCanadaCaribbeanCentral AmericaChileChinaColombiaCongoCosta RicaCroatiaCubaCzechoslovakiaDenmarkDominicaDominican RepublicEastern AfricaEastern AsiaEastern EuropeEcuadorEgyptEl SalvadorEnglandEritreaEthiopiaEuropeFijiFranceGermanyGhanaGreeceGrenadaGuatemalaGuyanaHaitiHondurasHong KongHungaryIndiaIndonesiaIranIraqIrelandIsraelItalyJamaicaJapanJordanKazakhstanKenyaKoreaKuwaitLaosLatin AmericaLatviaLebanonLiberiaLithuaniaMalaysiaMexicoMicronesiaMiddle AfricaMoldovaMoroccoNepalNetherlandsNicaraguaNigeriaNorth AmericaNorth MacedoniaNorthern AfricaNorthern EuropeNorwayOceaniaPakistanPanamaPeruPhilippinesPolandPortugalRomaniaRussiaSaudi ArabiaScotlandSenegalSerbiaSierra LeoneSingaporeSomaliaSouth AfricaSouth AmericaSouth Central AsiaSouth Eastern AsiaSouthern EuropeSpainSri LankaSt. Vincent and the GrenadinesSudanSwedenSwitzerlandSyriaTaiwanThailandTrinidad and TobagoTurkeyUgandaUkraineUruguayUzbekistanVenezuelaVietnamWest IndiesWestern AfricaWestern AsiaWestern EuropeYemenZaireZimbabweAzores
Married-Couple Family Poverty
Income
Poverty
Unemployment
Labor Participation
Family Structure
Vehicle Availability
Education Level
Disability

Armenian Married-Couple Family Poverty
Poor

5.5%
POVERTY | MARRIED-COUPLE FAMILIES
12.8/ 100
METRIC RATING
215th/ 347
METRIC RANK

Armenian Married-Couple Family Poverty Correlation Chart

The statistical analysis conducted on geographies consisting of 308,319,420 people shows a mild positive correlation between the proportion of Armenians and poverty level among married-couple families in the United States with a correlation coefficient (R) of 0.320 and weighted average of 5.5%. On average, for every 1% (one percent) increase in Armenians within a typical geography, there is an increase of 0.079% in poverty level among married-couple families.
Armenian Married-Couple Family Poverty
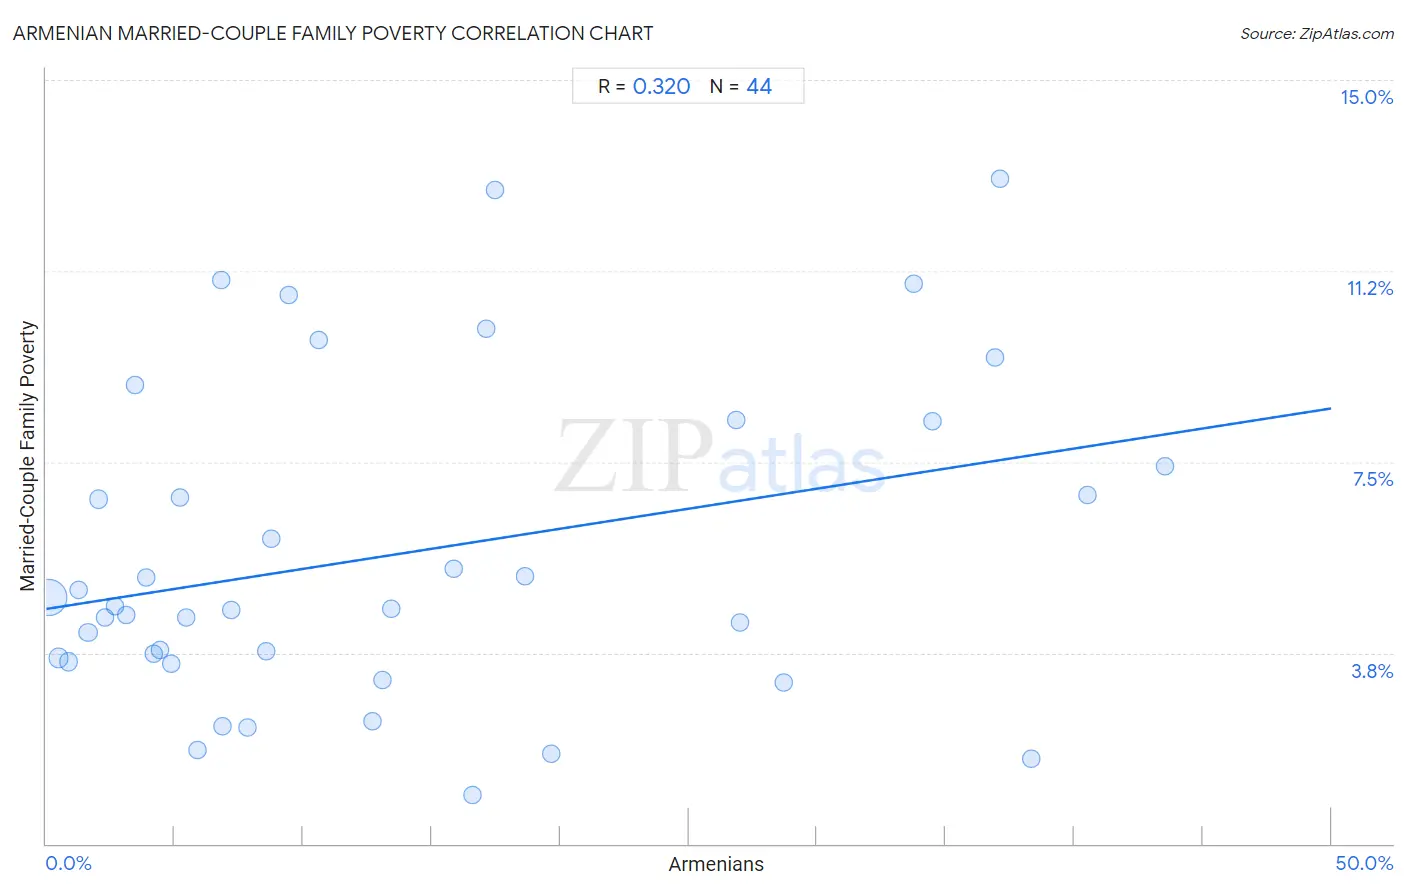
It is essential to understand that the correlation between the percentage of Armenians and poverty level among married-couple families does not imply a direct cause-and-effect relationship. It remains uncertain whether the presence of Armenians influences an upward or downward trend in the level of poverty level among married-couple families within an area, or if Armenians simply ended up residing in those areas with higher or lower levels of poverty level among married-couple families due to other factors.

Demographics Similar to Armenians by Married-Couple Family Poverty

In terms of married-couple family poverty, the demographic groups most similar to Armenians are Iroquois (5.5%, a difference of 0.060%), Immigrants from Liberia (5.5%, a difference of 0.11%), Potawatomi (5.5%, a difference of 0.12%), Immigrants from Thailand (5.5%, a difference of 0.29%), and Nigerian (5.5%, a difference of 0.35%).
DemographicsRating | RankMarried-Couple Family Poverty
French American Indians
16.1
/100
|
#208
Poor
5.5%
Immigrants from Syria
15.4
/100
|
#209
Poor
5.5%
Immigrants from Micronesia
14.4
/100
|
#210
Poor
5.5%
Nigerians
14.3
/100
|
#211
Poor
5.5%
Immigrants from Thailand
14.0
/100
|
#212
Poor
5.5%
Immigrants from Liberia
13.3
/100
|
#213
Poor
5.5%
Iroquois
13.1
/100
|
#214
Poor
5.5%
Armenians
12.8
/100
|
#215
Poor
5.5%
Potawatomi
12.4
/100
|
#216
Poor
5.5%
Immigrants from Nigeria
11.3
/100
|
#217
Poor
5.5%
Afghans
11.2
/100
|
#218
Poor
5.5%
Japanese
9.8
/100
|
#219
Tragic
5.6%
Colombians
9.2
/100
|
#220
Tragic
5.6%
Panamanians
9.2
/100
|
#221
Tragic
5.6%
Cajuns
6.9
/100
|
#222
Tragic
5.6%

Armenian Married-Couple Family Poverty Correlation Summary

MeasurementArmenian DataMarried-Couple Family Poverty Data
Minimum0.097%0.96%
Maximum43.5%13.1%
Range43.4%12.1%
Mean13.9%5.7%
Median8.6%4.7%
Interquartile 25% (IQ1)4.0%3.6%
Interquartile 75% (IQ3)19.1%7.9%
Interquartile Range (IQR)15.1%4.2%
Standard Deviation (Sample)12.8%3.1%
Standard Deviation (Population)12.7%3.1%

Correlation Details

Armenian PercentileSample SizeMarried-Couple Family Poverty
[
0.0%
-
0.5%
]
0.097%
268,798,9474.8%
[
0.0%
-
0.5%
]
0.49%
23,077,3493.7%
[
0.5%
-
1.0%
]
0.87%
5,136,6753.6%
[
1.0%
-
1.5%
]
1.24%
2,824,3585.0%
[
1.5%
-
2.0%
]
1.63%
813,9604.2%
[
2.0%
-
2.5%
]
2.02%
4,828,9026.8%
[
2.0%
-
2.5%
]
2.30%
508,9324.5%
[
2.5%
-
3.0%
]
2.68%
498,4724.7%
[
3.0%
-
3.5%
]
3.13%
109,1094.5%
[
3.0%
-
3.5%
]
3.45%
253,4959.0%
[
3.5%
-
4.0%
]
3.89%
17,1825.2%
[
4.0%
-
4.5%
]
4.18%
66,7373.7%
[
4.0%
-
4.5%
]
4.45%
108,4483.8%
[
4.5%
-
5.0%
]
4.87%
29,8873.5%
[
5.0%
-
5.5%
]
5.22%
90,7786.8%
[
5.0%
-
5.5%
]
5.45%
106,0184.4%
[
5.5%
-
6.0%
]
5.90%
88,7971.8%
[
6.5%
-
7.0%
]
6.80%
60,34511.1%
[
6.5%
-
7.0%
]
6.86%
42,7192.3%
[
7.0%
-
7.5%
]
7.19%
20,0924.6%
[
7.5%
-
8.0%
]
7.81%
4,9822.3%
[
8.5%
-
9.0%
]
8.54%
72,4213.8%
[
8.5%
-
9.0%
]
8.76%
145,2276.0%
[
9.0%
-
9.5%
]
9.41%
43,55210.8%
[
10.5%
-
11.0%
]
10.62%
51,6549.9%
[
12.5%
-
13.0%
]
12.69%
32,8272.4%
[
13.0%
-
13.5%
]
13.08%
6503.2%
[
13.0%
-
13.5%
]
13.41%
27,4794.6%
[
15.5%
-
16.0%
]
15.85%
2,0385.4%
[
16.5%
-
17.0%
]
16.58%
20,9110.96%
[
17.0%
-
17.5%
]
17.10%
31010.1%
[
17.0%
-
17.5%
]
17.46%
8,20912.9%
[
18.5%
-
19.0%
]
18.65%
4295.3%
[
19.5%
-
20.0%
]
19.65%
12,3121.8%
[
26.5%
-
27.0%
]
26.83%
45,5648.3%
[
26.5%
-
27.0%
]
26.98%
15,3774.3%
[
28.5%
-
29.0%
]
28.71%
18,9513.2%
[
33.5%
-
34.0%
]
33.78%
16,67911.0%
[
34.5%
-
35.0%
]
34.51%
194,5128.3%
[
36.5%
-
37.0%
]
36.93%
32,2949.6%
[
37.0%
-
37.5%
]
37.12%
35,75513.1%
[
38.0%
-
38.5%
]
38.33%
11,0911.7%
[
40.5%
-
41.0%
]
40.51%
22,8316.8%
[
43.5%
-
44.0%
]
43.52%
22,1637.4%