Armenian 1 or more Vehicles in Household

COMPARE

Armenian
Race
Ancestry
AfghanAfricanAlaska NativeAlaskan AthabascanAlbanianAleutAlsatianAmericanApacheArabArapahoArgentineanArmenianAssyrian/Chaldean/SyriacAustralianAustrianBahamianBangladeshiBarbadianBasqueBelgianBelizeanBermudanBhutaneseBlackfeetBolivianBrazilianBritishBritish West IndianBulgarianBurmeseCajunCambodianCanadianCape VerdeanCarpatho RusynCelticCentral AmericanCentral American IndianCherokeeCheyenneChickasawChileanChineseChippewaChoctawColombianColvilleComancheCosta RicanCreeCreekCroatianCrowCubanCypriotCzechCzechoslovakianDanishDelawareDominicanDutchDutch West IndianEastern EuropeanEcuadorianEgyptianEnglishEstonianEthiopianEuropeanFijianFilipinoFinnishFrenchFrench American IndianFrench CanadianGermanGerman RussianGhanaianGreekGuamanian/ChamorroGuatemalanGuyaneseHaitianHmongHonduranHopiHoumaHungarianIcelanderIndian (Asian)IndonesianInupiatIranianIraqiIrishIroquoisIsraeliItalianJamaicanJapaneseJordanianKenyanKiowaKoreanLaotianLatvianLebaneseLiberianLithuanianLumbeeLuxembourgerMacedonianMalaysianMalteseMarshalleseMenomineeMexicanMexican American IndianMongolianMoroccanNative HawaiianNavajoNepaleseNew ZealanderNicaraguanNigerianNorthern EuropeanNorwegianOkinawanOsageOttawaPaiutePakistaniPalestinianPanamanianParaguayanPennsylvania GermanPeruvianPimaPolishPortuguesePotawatomiPuebloPuerto RicanPuget Sound SalishRomanianRussianSalvadoranSamoanScandinavianScotch-IrishScottishSeminoleSenegaleseSerbianShoshoneSierra LeoneanSiouxSlavicSlovakSloveneSomaliSouth AfricanSouth AmericanSouth American IndianSoviet UnionSpaniardSpanishSpanish AmericanSpanish American IndianSri LankanSubsaharan AfricanSudaneseSwedishSwissSyrianTaiwaneseThaiTlingit-HaidaTohono O'OdhamTonganTrinidadian and TobagonianTsimshianTurkishU.S. Virgin IslanderUgandanUkrainianUruguayanUteVenezuelanVietnameseWelshWest IndianYakamaYaquiYugoslavianYumanYup'ikZimbabwean
Immigration
NonimmigrantsImmigrantsAfghanistanAfricaAlbaniaArgentinaArmeniaAsiaAustraliaAustriaBahamasBangladeshBarbadosBelarusBelgiumBelizeBoliviaBosnia and HerzegovinaBrazilBulgariaBurma/MyanmarCabo VerdeCambodiaCameroonCanadaCaribbeanCentral AmericaChileChinaColombiaCongoCosta RicaCroatiaCubaCzechoslovakiaDenmarkDominicaDominican RepublicEastern AfricaEastern AsiaEastern EuropeEcuadorEgyptEl SalvadorEnglandEritreaEthiopiaEuropeFijiFranceGermanyGhanaGreeceGrenadaGuatemalaGuyanaHaitiHondurasHong KongHungaryIndiaIndonesiaIranIraqIrelandIsraelItalyJamaicaJapanJordanKazakhstanKenyaKoreaKuwaitLaosLatin AmericaLatviaLebanonLiberiaLithuaniaMalaysiaMexicoMicronesiaMiddle AfricaMoldovaMoroccoNepalNetherlandsNicaraguaNigeriaNorth AmericaNorth MacedoniaNorthern AfricaNorthern EuropeNorwayOceaniaPakistanPanamaPeruPhilippinesPolandPortugalRomaniaRussiaSaudi ArabiaScotlandSenegalSerbiaSierra LeoneSingaporeSomaliaSouth AfricaSouth AmericaSouth Central AsiaSouth Eastern AsiaSouthern EuropeSpainSri LankaSt. Vincent and the GrenadinesSudanSwedenSwitzerlandSyriaTaiwanThailandTrinidad and TobagoTurkeyUgandaUkraineUruguayUzbekistanVenezuelaVietnamWest IndiesWestern AfricaWestern AsiaWestern EuropeYemenZaireZimbabweAzores
Select to Compare
Race
Ancestry
AfghanAfricanAlaska NativeAlaskan AthabascanAlbanianAleutAlsatianAmericanApacheArabArapahoArgentineanAssyrian/Chaldean/SyriacAustralianAustrianBahamianBangladeshiBarbadianBasqueBelgianBelizeanBermudanBhutaneseBlackfeetBolivianBrazilianBritishBritish West IndianBulgarianBurmeseCajunCambodianCanadianCape VerdeanCarpatho RusynCelticCentral AmericanCentral American IndianCherokeeCheyenneChickasawChileanChineseChippewaChoctawColombianColvilleComancheCosta RicanCreeCreekCroatianCrowCubanCypriotCzechCzechoslovakianDanishDelawareDominicanDutchDutch West IndianEastern EuropeanEcuadorianEgyptianEnglishEstonianEthiopianEuropeanFijianFilipinoFinnishFrenchFrench American IndianFrench CanadianGermanGerman RussianGhanaianGreekGuamanian/ChamorroGuatemalanGuyaneseHaitianHmongHonduranHopiHoumaHungarianIcelanderIndian (Asian)IndonesianInupiatIranianIraqiIrishIroquoisIsraeliItalianJamaicanJapaneseJordanianKenyanKiowaKoreanLaotianLatvianLebaneseLiberianLithuanianLumbeeLuxembourgerMacedonianMalaysianMalteseMarshalleseMenomineeMexicanMexican American IndianMongolianMoroccanNative HawaiianNavajoNepaleseNew ZealanderNicaraguanNigerianNorthern EuropeanNorwegianOkinawanOsageOttawaPaiutePakistaniPalestinianPanamanianParaguayanPennsylvania GermanPeruvianPimaPolishPortuguesePotawatomiPuebloPuerto RicanPuget Sound SalishRomanianRussianSalvadoranSamoanScandinavianScotch-IrishScottishSeminoleSenegaleseSerbianShoshoneSierra LeoneanSiouxSlavicSlovakSloveneSomaliSouth AfricanSouth AmericanSouth American IndianSoviet UnionSpaniardSpanishSpanish AmericanSpanish American IndianSri LankanSubsaharan AfricanSudaneseSwedishSwissSyrianTaiwaneseThaiTlingit-HaidaTohono O'OdhamTonganTrinidadian and TobagonianTsimshianTurkishU.S. Virgin IslanderUgandanUkrainianUruguayanUteVenezuelanVietnameseWelshWest IndianYakamaYaquiYugoslavianYumanYup'ikZimbabwean
Immigration
NonimmigrantsImmigrantsAfghanistanAfricaAlbaniaArgentinaArmeniaAsiaAustraliaAustriaBahamasBangladeshBarbadosBelarusBelgiumBelizeBoliviaBosnia and HerzegovinaBrazilBulgariaBurma/MyanmarCabo VerdeCambodiaCameroonCanadaCaribbeanCentral AmericaChileChinaColombiaCongoCosta RicaCroatiaCubaCzechoslovakiaDenmarkDominicaDominican RepublicEastern AfricaEastern AsiaEastern EuropeEcuadorEgyptEl SalvadorEnglandEritreaEthiopiaEuropeFijiFranceGermanyGhanaGreeceGrenadaGuatemalaGuyanaHaitiHondurasHong KongHungaryIndiaIndonesiaIranIraqIrelandIsraelItalyJamaicaJapanJordanKazakhstanKenyaKoreaKuwaitLaosLatin AmericaLatviaLebanonLiberiaLithuaniaMalaysiaMexicoMicronesiaMiddle AfricaMoldovaMoroccoNepalNetherlandsNicaraguaNigeriaNorth AmericaNorth MacedoniaNorthern AfricaNorthern EuropeNorwayOceaniaPakistanPanamaPeruPhilippinesPolandPortugalRomaniaRussiaSaudi ArabiaScotlandSenegalSerbiaSierra LeoneSingaporeSomaliaSouth AfricaSouth AmericaSouth Central AsiaSouth Eastern AsiaSouthern EuropeSpainSri LankaSt. Vincent and the GrenadinesSudanSwedenSwitzerlandSyriaTaiwanThailandTrinidad and TobagoTurkeyUgandaUkraineUruguayUzbekistanVenezuelaVietnamWest IndiesWestern AfricaWestern AsiaWestern EuropeYemenZaireZimbabweAzores
1 or more Vehicles in Household
Income
Poverty
Unemployment
Labor Participation
Family Structure
Vehicle Availability
Education Level
Disability

Armenian 1 or more Vehicles in Household
Exceptional

90.7%
1+ VEHICLES AVAILABLE
94.5/ 100
METRIC RATING
114th/ 347
METRIC RANK

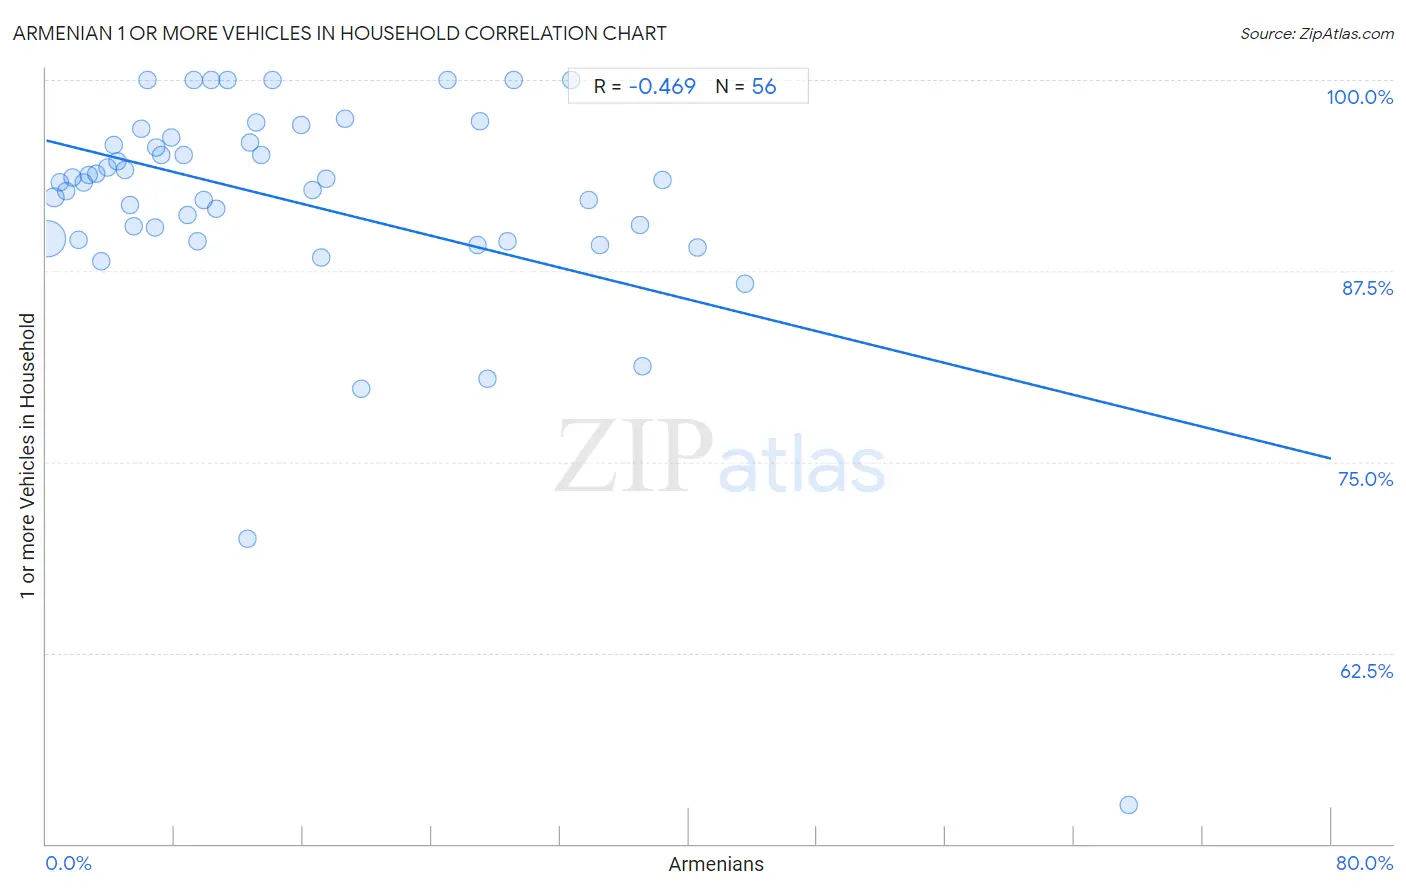
Armenian 1 or more Vehicles in Household Correlation Chart

The statistical analysis conducted on geographies consisting of 310,834,623 people shows a moderate negative correlation between the proportion of Armenians and percentage of households with 1 or more vehicles available in the United States with a correlation coefficient (R) of -0.469 and weighted average of 90.7%. On average, for every 1% (one percent) increase in Armenians within a typical geography, there is a decrease of 0.26% in percentage of households with 1 or more vehicles available.
Armenian 1 or more Vehicles in Household
It is essential to understand that the correlation between the percentage of Armenians and percentage of households with 1 or more vehicles available does not imply a direct cause-and-effect relationship. It remains uncertain whether the presence of Armenians influences an upward or downward trend in the level of percentage of households with 1 or more vehicles available within an area, or if Armenians simply ended up residing in those areas with higher or lower levels of percentage of households with 1 or more vehicles available due to other factors.

Demographics Similar to Armenians by 1 or more Vehicles in Household

In terms of 1 or more vehicles in household, the demographic groups most similar to Armenians are Immigrants from Kuwait (90.7%, a difference of 0.020%), Serbian (90.7%, a difference of 0.020%), Chippewa (90.7%, a difference of 0.020%), Greek (90.6%, a difference of 0.070%), and Japanese (90.6%, a difference of 0.080%).
DemographicsRating | Rank1 or more Vehicles in Household
Maltese
97.7
/100
|
#107
Exceptional
91.0%
Hispanics or Latinos
97.6
/100
|
#108
Exceptional
91.0%
Delaware
97.6
/100
|
#109
Exceptional
91.0%
Mexican American Indians
97.4
/100
|
#110
Exceptional
91.0%
Navajo
95.8
/100
|
#111
Exceptional
90.8%
Immigrants from Netherlands
95.7
/100
|
#112
Exceptional
90.8%
Immigrants from Kuwait
94.7
/100
|
#113
Exceptional
90.7%
Armenians
94.5
/100
|
#114
Exceptional
90.7%
Serbians
94.3
/100
|
#115
Exceptional
90.7%
Chippewa
94.3
/100
|
#116
Exceptional
90.7%
Greeks
93.5
/100
|
#117
Exceptional
90.6%
Japanese
93.4
/100
|
#118
Exceptional
90.6%
Blackfeet
92.6
/100
|
#119
Exceptional
90.6%
Immigrants from Thailand
92.3
/100
|
#120
Exceptional
90.6%
Icelanders
92.1
/100
|
#121
Exceptional
90.5%

Armenian 1 or more Vehicles in Household Correlation Summary

MeasurementArmenian Data1 or more Vehicles in Household Data
Minimum0.098%52.6%
Maximum67.4%100.0%
Range67.3%47.4%
Mean15.4%92.0%
Median10.4%93.4%
Interquartile 25% (IQ1)5.0%89.6%
Interquartile 75% (IQ3)25.9%96.1%
Interquartile Range (IQR)20.9%6.5%
Standard Deviation (Sample)14.0%7.8%
Standard Deviation (Population)13.9%7.7%

Correlation Details

Armenian PercentileSample Size1 or more Vehicles in Household
[
0.0%
-
0.5%
]
0.098%
270,260,86989.6%
[
0.0%
-
0.5%
]
0.49%
23,661,83992.3%
[
0.5%
-
1.0%
]
0.87%
5,366,87593.3%
[
1.0%
-
1.5%
]
1.24%
2,935,81392.7%
[
1.5%
-
2.0%
]
1.62%
854,70193.6%
[
2.0%
-
2.5%
]
2.02%
4,862,02889.5%
[
2.0%
-
2.5%
]
2.30%
516,62293.3%
[
2.5%
-
3.0%
]
2.68%
505,46993.8%
[
3.0%
-
3.5%
]
3.12%
111,74493.8%
[
3.0%
-
3.5%
]
3.45%
259,46288.2%
[
3.5%
-
4.0%
]
3.83%
26,36694.3%
[
4.0%
-
4.5%
]
4.18%
69,51795.7%
[
4.0%
-
4.5%
]
4.45%
112,16594.6%
[
4.5%
-
5.0%
]
4.87%
31,27794.1%
[
5.0%
-
5.5%
]
5.22%
90,87491.8%
[
5.0%
-
5.5%
]
5.46%
109,63190.4%
[
5.5%
-
6.0%
]
5.90%
88,79796.8%
[
6.0%
-
6.5%
]
6.27%
829100.0%
[
6.5%
-
7.0%
]
6.80%
60,34590.3%
[
6.5%
-
7.0%
]
6.86%
44,24495.6%
[
7.0%
-
7.5%
]
7.19%
20,09295.1%
[
7.5%
-
8.0%
]
7.76%
7,34496.3%
[
8.5%
-
9.0%
]
8.54%
72,42195.1%
[
8.5%
-
9.0%
]
8.76%
145,22791.2%
[
9.0%
-
9.5%
]
9.19%
468100.0%
[
9.0%
-
9.5%
]
9.42%
43,89389.4%
[
9.5%
-
10.0%
]
9.80%
1,20492.2%
[
10.0%
-
10.5%
]
10.27%
224100.0%
[
10.5%
-
11.0%
]
10.62%
51,65491.6%
[
11.0%
-
11.5%
]
11.28%
133100.0%
[
12.0%
-
12.5%
]
12.50%
1670.0%
[
12.5%
-
13.0%
]
12.69%
33,16395.9%
[
13.0%
-
13.5%
]
13.08%
65097.2%
[
13.0%
-
13.5%
]
13.41%
27,52395.1%
[
14.0%
-
14.5%
]
14.08%
206100.0%
[
15.5%
-
16.0%
]
15.89%
2,64497.1%
[
16.5%
-
17.0%
]
16.58%
20,91192.8%
[
17.0%
-
17.5%
]
17.10%
31088.4%
[
17.0%
-
17.5%
]
17.46%
8,20993.5%
[
18.5%
-
19.0%
]
18.64%
49997.5%
[
19.5%
-
20.0%
]
19.65%
12,31279.8%
[
25.0%
-
25.5%
]
25.00%
116100.0%
[
26.5%
-
27.0%
]
26.83%
45,56489.2%
[
26.5%
-
27.0%
]
26.98%
15,46597.3%
[
27.0%
-
27.5%
]
27.43%
22680.5%
[
28.5%
-
29.0%
]
28.71%
18,95189.4%
[
29.0%
-
29.5%
]
29.11%
158100.0%
[
32.5%
-
33.0%
]
32.71%
107100.0%
[
33.5%
-
34.0%
]
33.78%
16,67992.1%
[
34.5%
-
35.0%
]
34.51%
194,51289.2%
[
36.5%
-
37.0%
]
36.93%
32,29490.5%
[
37.0%
-
37.5%
]
37.12%
35,75581.2%
[
38.0%
-
38.5%
]
38.33%
11,09193.4%
[
40.5%
-
41.0%
]
40.51%
22,83189.0%
[
43.5%
-
44.0%
]
43.52%
22,16386.6%
[
67.0%
-
67.5%
]
67.38%
14152.6%