Turkish GED/Equivalency
COMPARE
Turkish
Select to Compare
GED/Equivalency
Turkish GED/Equivalency
88.5%
GED/EQUIVALENCY
99.8/ 100
METRIC RATING
30th/ 347
METRIC RANK
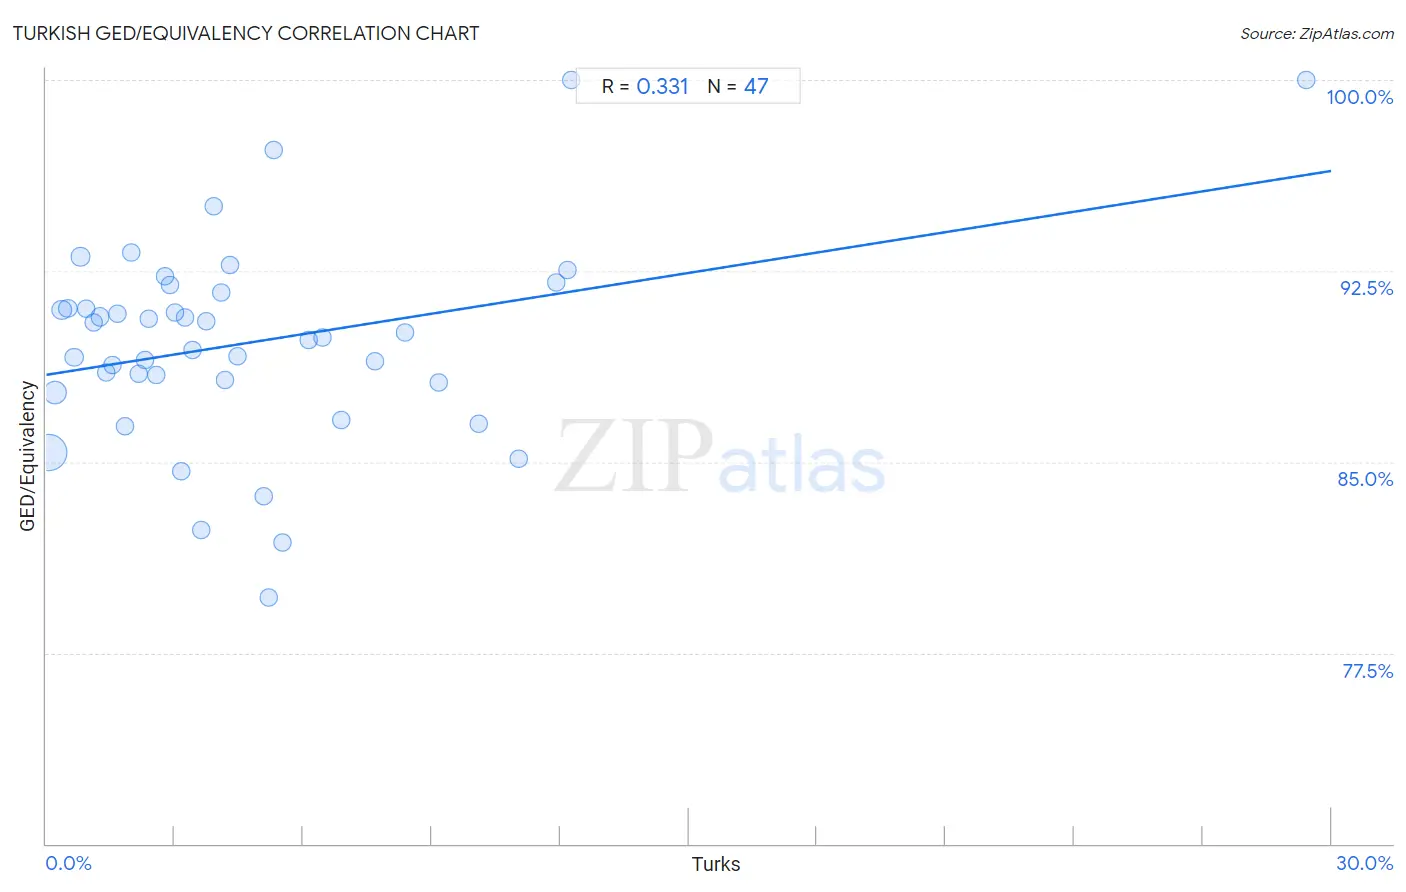
Turkish GED/Equivalency Correlation Chart
The statistical analysis conducted on geographies consisting of 271,864,133 people shows a mild positive correlation between the proportion of Turks and percentage of population with at least ged/equivalency education in the United States with a correlation coefficient (R) of 0.331 and weighted average of 88.5%. On average, for every 1% (one percent) increase in Turks within a typical geography, there is an increase of 0.27% in percentage of population with at least ged/equivalency education.
It is essential to understand that the correlation between the percentage of Turks and percentage of population with at least ged/equivalency education does not imply a direct cause-and-effect relationship. It remains uncertain whether the presence of Turks influences an upward or downward trend in the level of percentage of population with at least ged/equivalency education within an area, or if Turks simply ended up residing in those areas with higher or lower levels of percentage of population with at least ged/equivalency education due to other factors.
Demographics Similar to Turks by GED/Equivalency
In terms of ged/equivalency, the demographic groups most similar to Turks are Polish (88.5%, a difference of 0.020%), Bhutanese (88.4%, a difference of 0.030%), Immigrants from Northern Europe (88.5%, a difference of 0.050%), Danish (88.4%, a difference of 0.050%), and Immigrants from Lithuania (88.6%, a difference of 0.090%).
| Demographics | Rating | Rank | GED/Equivalency |
| Russians | 99.8 /100 | #23 | Exceptional 88.6% |
| Slovaks | 99.8 /100 | #24 | Exceptional 88.6% |
| Estonians | 99.8 /100 | #25 | Exceptional 88.6% |
| Immigrants from Australia | 99.8 /100 | #26 | Exceptional 88.6% |
| Immigrants from Lithuania | 99.8 /100 | #27 | Exceptional 88.6% |
| Immigrants from Northern Europe | 99.8 /100 | #28 | Exceptional 88.5% |
| Poles | 99.8 /100 | #29 | Exceptional 88.5% |
| Turks | 99.8 /100 | #30 | Exceptional 88.5% |
| Bhutanese | 99.8 /100 | #31 | Exceptional 88.4% |
| Danes | 99.8 /100 | #32 | Exceptional 88.4% |
| Immigrants from Sweden | 99.7 /100 | #33 | Exceptional 88.4% |
| Immigrants from Japan | 99.7 /100 | #34 | Exceptional 88.4% |
| Immigrants from South Central Asia | 99.7 /100 | #35 | Exceptional 88.4% |
| Immigrants from Belgium | 99.7 /100 | #36 | Exceptional 88.3% |
| Immigrants from Austria | 99.7 /100 | #37 | Exceptional 88.3% |
Turkish GED/Equivalency Correlation Summary
| Measurement | Turkish Data | GED/Equivalency Data |
| Minimum | 0.061% | 79.7% |
| Maximum | 29.4% | 100.0% |
| Range | 29.4% | 20.3% |
| Mean | 4.7% | 89.7% |
| Median | 3.4% | 89.9% |
| Interquartile 25% (IQ1) | 1.7% | 88.1% |
| Interquartile 75% (IQ3) | 6.1% | 91.7% |
| Interquartile Range (IQR) | 4.5% | 3.5% |
| Standard Deviation (Sample) | 5.0% | 4.0% |
| Standard Deviation (Population) | 4.9% | 4.0% |
Correlation Details
| Turkish Percentile | Sample Size | GED/Equivalency |
[ 0.0% - 0.5% ] 0.061% | 189,254,701 | 85.4% |
[ 0.0% - 0.5% ] 0.20% | 49,241,067 | 87.7% |
[ 0.0% - 0.5% ] 0.36% | 14,871,965 | 91.0% |
[ 0.5% - 1.0% ] 0.51% | 7,043,283 | 91.0% |
[ 0.5% - 1.0% ] 0.65% | 3,926,514 | 89.1% |
[ 0.5% - 1.0% ] 0.80% | 2,298,833 | 93.1% |
[ 0.5% - 1.0% ] 0.94% | 1,523,459 | 91.0% |
[ 1.0% - 1.5% ] 1.11% | 754,314 | 90.5% |
[ 1.0% - 1.5% ] 1.25% | 612,680 | 90.7% |
[ 1.0% - 1.5% ] 1.40% | 451,621 | 88.5% |
[ 1.5% - 2.0% ] 1.54% | 542,506 | 88.8% |
[ 1.5% - 2.0% ] 1.66% | 261,797 | 90.8% |
[ 1.5% - 2.0% ] 1.83% | 294,868 | 86.4% |
[ 1.5% - 2.0% ] 1.98% | 148,588 | 93.2% |
[ 2.0% - 2.5% ] 2.16% | 97,197 | 88.4% |
[ 2.0% - 2.5% ] 2.31% | 67,365 | 89.0% |
[ 2.0% - 2.5% ] 2.40% | 61,942 | 90.6% |
[ 2.5% - 3.0% ] 2.56% | 50,190 | 88.4% |
[ 2.5% - 3.0% ] 2.77% | 33,548 | 92.3% |
[ 2.5% - 3.0% ] 2.88% | 54,287 | 91.9% |
[ 3.0% - 3.5% ] 3.01% | 52,389 | 90.9% |
[ 3.0% - 3.5% ] 3.16% | 3,611 | 84.7% |
[ 3.0% - 3.5% ] 3.25% | 17,340 | 90.7% |
[ 3.0% - 3.5% ] 3.42% | 1,314 | 89.4% |
[ 3.5% - 4.0% ] 3.62% | 33,609 | 82.3% |
[ 3.5% - 4.0% ] 3.73% | 31,781 | 90.5% |
[ 3.5% - 4.0% ] 3.90% | 13,394 | 95.0% |
[ 4.0% - 4.5% ] 4.10% | 11,623 | 91.7% |
[ 4.0% - 4.5% ] 4.18% | 26,829 | 88.2% |
[ 4.0% - 4.5% ] 4.29% | 19,287 | 92.8% |
[ 4.0% - 4.5% ] 4.47% | 10,897 | 89.2% |
[ 5.0% - 5.5% ] 5.08% | 59 | 83.7% |
[ 5.0% - 5.5% ] 5.19% | 1,463 | 79.7% |
[ 5.0% - 5.5% ] 5.30% | 434 | 97.3% |
[ 5.5% - 6.0% ] 5.51% | 381 | 81.9% |
[ 6.0% - 6.5% ] 6.13% | 1,616 | 89.8% |
[ 6.0% - 6.5% ] 6.44% | 21,950 | 89.9% |
[ 6.5% - 7.0% ] 6.90% | 29 | 86.7% |
[ 7.5% - 8.0% ] 7.66% | 4,150 | 88.9% |
[ 8.0% - 8.5% ] 8.36% | 11,458 | 90.1% |
[ 9.0% - 9.5% ] 9.17% | 1,669 | 88.1% |
[ 10.0% - 10.5% ] 10.10% | 5,476 | 86.5% |
[ 11.0% - 11.5% ] 11.04% | 1,857 | 85.1% |
[ 11.5% - 12.0% ] 11.91% | 235 | 92.1% |
[ 12.0% - 12.5% ] 12.16% | 148 | 92.5% |
[ 12.0% - 12.5% ] 12.27% | 375 | 100.0% |
[ 29.0% - 29.5% ] 29.41% | 34 | 100.0% |