Turkish Unemployment Among Women with Children Ages 6 to 17 years
COMPARE
Turkish
Select to Compare
Unemployment Among Women with Children Ages 6 to 17 years
Turkish Unemployment Among Women with Children Ages 6 to 17 years
8.9%
UNEMPLOYMENT | WOMEN W/ CHILDREN 6 TO 17
54.1/ 100
METRIC RATING
170th/ 347
METRIC RANK
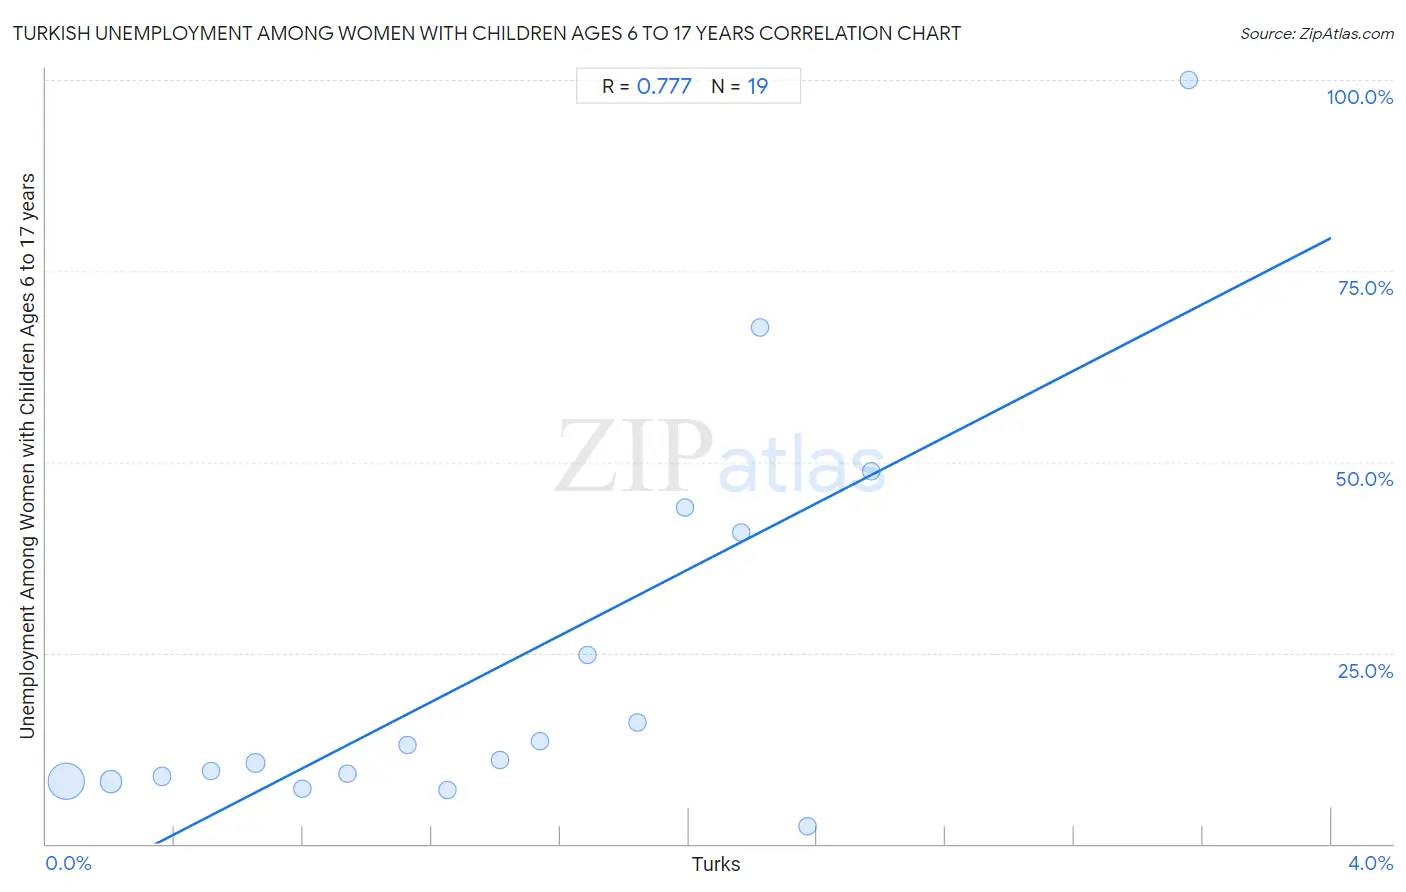
Turkish Unemployment Among Women with Children Ages 6 to 17 years Correlation Chart
The statistical analysis conducted on geographies consisting of 207,852,412 people shows a strong positive correlation between the proportion of Turks and unemployment rate among women with children between the ages 6 and 17 in the United States with a correlation coefficient (R) of 0.777 and weighted average of 8.9%. On average, for every 1% (one percent) increase in Turks within a typical geography, there is an increase of 21.7% in unemployment rate among women with children between the ages 6 and 17.
It is essential to understand that the correlation between the percentage of Turks and unemployment rate among women with children between the ages 6 and 17 does not imply a direct cause-and-effect relationship. It remains uncertain whether the presence of Turks influences an upward or downward trend in the level of unemployment rate among women with children between the ages 6 and 17 within an area, or if Turks simply ended up residing in those areas with higher or lower levels of unemployment rate among women with children between the ages 6 and 17 due to other factors.
Demographics Similar to Turks by Unemployment Among Women with Children Ages 6 to 17 years
In terms of unemployment among women with children ages 6 to 17 years, the demographic groups most similar to Turks are British (8.9%, a difference of 0.050%), Jordanian (9.0%, a difference of 0.090%), Immigrants from West Indies (9.0%, a difference of 0.090%), Immigrants from Croatia (8.9%, a difference of 0.13%), and Immigrants from Brazil (9.0%, a difference of 0.14%).
| Demographics | Rating | Rank | Unemployment Among Women with Children Ages 6 to 17 years |
| Mexican American Indians | 60.6 /100 | #163 | Good 8.9% |
| Ukrainians | 59.7 /100 | #164 | Average 8.9% |
| Immigrants from Micronesia | 59.2 /100 | #165 | Average 8.9% |
| Moroccans | 58.3 /100 | #166 | Average 8.9% |
| Immigrants from England | 57.7 /100 | #167 | Average 8.9% |
| Immigrants from Croatia | 57.1 /100 | #168 | Average 8.9% |
| British | 55.2 /100 | #169 | Average 8.9% |
| Turks | 54.1 /100 | #170 | Average 8.9% |
| Jordanians | 52.2 /100 | #171 | Average 9.0% |
| Immigrants from West Indies | 52.2 /100 | #172 | Average 9.0% |
| Immigrants from Brazil | 51.0 /100 | #173 | Average 9.0% |
| Immigrants from Costa Rica | 50.0 /100 | #174 | Average 9.0% |
| Immigrants from Sierra Leone | 45.9 /100 | #175 | Average 9.0% |
| Immigrants from Italy | 43.7 /100 | #176 | Average 9.0% |
| Immigrants from Jordan | 41.6 /100 | #177 | Average 9.0% |
Turkish Unemployment Among Women with Children Ages 6 to 17 years Correlation Summary
| Measurement | Turkish Data | Unemployment Among Women with Children Ages 6 to 17 years Data |
| Minimum | 0.061% | 2.3% |
| Maximum | 3.6% | 100.0% |
| Range | 3.5% | 97.7% |
| Mean | 1.4% | 23.7% |
| Median | 1.4% | 10.9% |
| Interquartile 25% (IQ1) | 0.65% | 8.2% |
| Interquartile 75% (IQ3) | 2.2% | 40.8% |
| Interquartile Range (IQR) | 1.5% | 32.6% |
| Standard Deviation (Sample) | 0.92% | 25.6% |
| Standard Deviation (Population) | 0.89% | 25.0% |
Correlation Details
| Turkish Percentile | Sample Size | Unemployment Among Women with Children Ages 6 to 17 years |
[ 0.0% - 0.5% ] 0.061% | 154,510,511 | 8.1% |
[ 0.0% - 0.5% ] 0.20% | 35,353,931 | 8.2% |
[ 0.0% - 0.5% ] 0.36% | 8,018,192 | 8.8% |
[ 0.5% - 1.0% ] 0.51% | 3,926,790 | 9.5% |
[ 0.5% - 1.0% ] 0.65% | 2,520,474 | 10.6% |
[ 0.5% - 1.0% ] 0.80% | 1,381,224 | 7.2% |
[ 0.5% - 1.0% ] 0.94% | 806,733 | 9.1% |
[ 1.0% - 1.5% ] 1.12% | 234,690 | 12.9% |
[ 1.0% - 1.5% ] 1.25% | 186,350 | 7.0% |
[ 1.0% - 1.5% ] 1.41% | 206,789 | 10.9% |
[ 1.5% - 2.0% ] 1.54% | 418,764 | 13.5% |
[ 1.5% - 2.0% ] 1.68% | 10,925 | 24.8% |
[ 1.5% - 2.0% ] 1.84% | 166,011 | 15.9% |
[ 1.5% - 2.0% ] 1.99% | 33,201 | 44.0% |
[ 2.0% - 2.5% ] 2.16% | 3,373 | 40.8% |
[ 2.0% - 2.5% ] 2.22% | 4,636 | 67.6% |
[ 2.0% - 2.5% ] 2.37% | 43,095 | 2.3% |
[ 2.5% - 3.0% ] 2.57% | 26,470 | 48.7% |
[ 3.5% - 4.0% ] 3.56% | 253 | 100.0% |