Turkish Married-couple Households
COMPARE
Turkish
Select to Compare
Married-couple Households
Turkish Married-couple Households
47.8%
MARRIED-COUPLE HOUSEHOLDS
96.1/ 100
METRIC RATING
101st/ 347
METRIC RANK
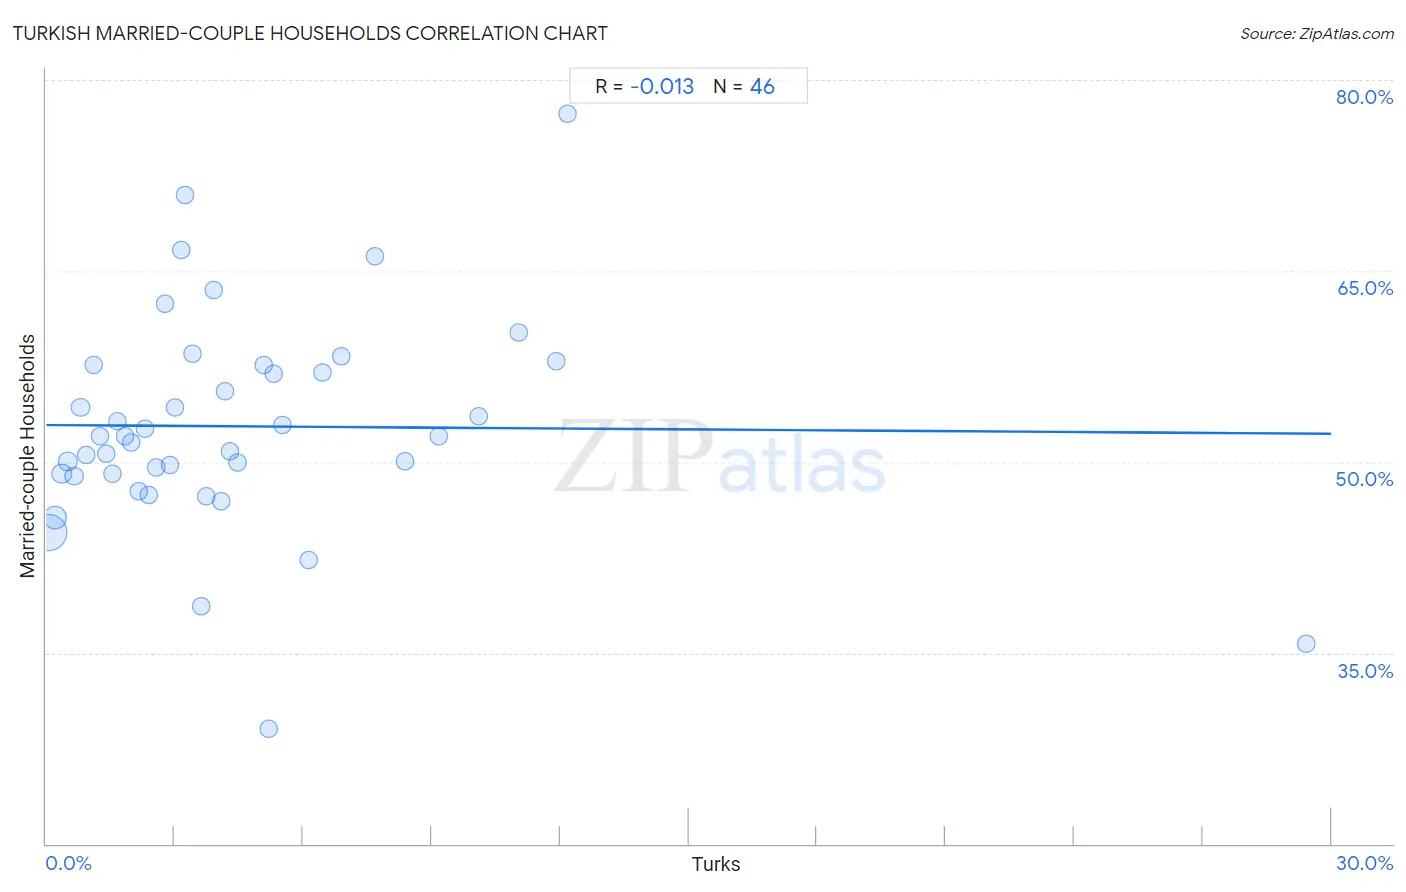
Turkish Married-couple Households Correlation Chart
The statistical analysis conducted on geographies consisting of 271,700,088 people shows no correlation between the proportion of Turks and percentage of married-couple family households in the United States with a correlation coefficient (R) of -0.013 and weighted average of 47.8%. On average, for every 1% (one percent) increase in Turks within a typical geography, there is a decrease of 0.023% in percentage of married-couple family households.
It is essential to understand that the correlation between the percentage of Turks and percentage of married-couple family households does not imply a direct cause-and-effect relationship. It remains uncertain whether the presence of Turks influences an upward or downward trend in the level of percentage of married-couple family households within an area, or if Turks simply ended up residing in those areas with higher or lower levels of percentage of married-couple family households due to other factors.
Demographics Similar to Turks by Married-couple Households
In terms of married-couple households, the demographic groups most similar to Turks are Slavic (47.8%, a difference of 0.020%), Hawaiian (47.8%, a difference of 0.020%), Immigrants from South Africa (47.8%, a difference of 0.030%), Immigrants from Italy (47.9%, a difference of 0.060%), and Immigrants from Austria (47.9%, a difference of 0.070%).
| Demographics | Rating | Rank | Married-couple Households |
| Americans | 96.9 /100 | #94 | Exceptional 47.9% |
| Immigrants from Belgium | 96.8 /100 | #95 | Exceptional 47.9% |
| Immigrants from Egypt | 96.6 /100 | #96 | Exceptional 47.9% |
| Latvians | 96.5 /100 | #97 | Exceptional 47.9% |
| Immigrants from North Macedonia | 96.4 /100 | #98 | Exceptional 47.9% |
| Immigrants from Austria | 96.4 /100 | #99 | Exceptional 47.9% |
| Immigrants from Italy | 96.3 /100 | #100 | Exceptional 47.9% |
| Turks | 96.1 /100 | #101 | Exceptional 47.8% |
| Slavs | 96.0 /100 | #102 | Exceptional 47.8% |
| Hawaiians | 96.0 /100 | #103 | Exceptional 47.8% |
| Immigrants from South Africa | 96.0 /100 | #104 | Exceptional 47.8% |
| Immigrants from Czechoslovakia | 95.5 /100 | #105 | Exceptional 47.8% |
| Portuguese | 95.5 /100 | #106 | Exceptional 47.8% |
| Estonians | 94.7 /100 | #107 | Exceptional 47.7% |
| Immigrants from Japan | 94.4 /100 | #108 | Exceptional 47.7% |
Turkish Married-couple Households Correlation Summary
| Measurement | Turkish Data | Married-couple Households Data |
| Minimum | 0.061% | 29.1% |
| Maximum | 29.4% | 77.4% |
| Range | 29.4% | 48.3% |
| Mean | 4.6% | 52.8% |
| Median | 3.3% | 52.0% |
| Interquartile 25% (IQ1) | 1.7% | 49.0% |
| Interquartile 75% (IQ3) | 5.5% | 57.6% |
| Interquartile Range (IQR) | 3.9% | 8.5% |
| Standard Deviation (Sample) | 4.9% | 8.5% |
| Standard Deviation (Population) | 4.8% | 8.4% |
Correlation Details
| Turkish Percentile | Sample Size | Married-couple Households |
[ 0.0% - 0.5% ] 0.061% | 189,216,185 | 44.5% |
[ 0.0% - 0.5% ] 0.20% | 49,210,828 | 45.7% |
[ 0.0% - 0.5% ] 0.36% | 14,806,410 | 49.0% |
[ 0.5% - 1.0% ] 0.51% | 7,034,761 | 50.0% |
[ 0.5% - 1.0% ] 0.65% | 3,917,964 | 48.9% |
[ 0.5% - 1.0% ] 0.80% | 2,297,408 | 54.3% |
[ 0.5% - 1.0% ] 0.94% | 1,523,459 | 50.5% |
[ 1.0% - 1.5% ] 1.11% | 748,389 | 57.6% |
[ 1.0% - 1.5% ] 1.25% | 612,680 | 52.0% |
[ 1.0% - 1.5% ] 1.40% | 450,847 | 50.7% |
[ 1.5% - 2.0% ] 1.54% | 538,342 | 49.0% |
[ 1.5% - 2.0% ] 1.66% | 261,797 | 53.2% |
[ 1.5% - 2.0% ] 1.83% | 294,868 | 52.0% |
[ 1.5% - 2.0% ] 1.98% | 148,588 | 51.5% |
[ 2.0% - 2.5% ] 2.16% | 97,197 | 47.7% |
[ 2.0% - 2.5% ] 2.31% | 67,365 | 52.6% |
[ 2.0% - 2.5% ] 2.40% | 61,942 | 47.4% |
[ 2.5% - 3.0% ] 2.56% | 50,190 | 49.6% |
[ 2.5% - 3.0% ] 2.77% | 33,548 | 62.4% |
[ 2.5% - 3.0% ] 2.88% | 54,287 | 49.7% |
[ 3.0% - 3.5% ] 3.01% | 52,389 | 54.3% |
[ 3.0% - 3.5% ] 3.16% | 3,611 | 66.7% |
[ 3.0% - 3.5% ] 3.25% | 17,340 | 70.9% |
[ 3.0% - 3.5% ] 3.42% | 1,314 | 58.5% |
[ 3.5% - 4.0% ] 3.62% | 33,609 | 38.6% |
[ 3.5% - 4.0% ] 3.73% | 31,781 | 47.3% |
[ 3.5% - 4.0% ] 3.90% | 13,394 | 63.5% |
[ 4.0% - 4.5% ] 4.10% | 11,623 | 46.9% |
[ 4.0% - 4.5% ] 4.18% | 26,829 | 55.6% |
[ 4.0% - 4.5% ] 4.29% | 19,287 | 50.9% |
[ 4.0% - 4.5% ] 4.47% | 10,897 | 50.0% |
[ 5.0% - 5.5% ] 5.08% | 59 | 57.6% |
[ 5.0% - 5.5% ] 5.19% | 1,463 | 29.1% |
[ 5.0% - 5.5% ] 5.30% | 434 | 56.9% |
[ 5.5% - 6.0% ] 5.51% | 381 | 52.9% |
[ 6.0% - 6.5% ] 6.13% | 1,616 | 42.2% |
[ 6.0% - 6.5% ] 6.44% | 21,950 | 57.0% |
[ 6.5% - 7.0% ] 6.90% | 29 | 58.3% |
[ 7.5% - 8.0% ] 7.66% | 4,150 | 66.1% |
[ 8.0% - 8.5% ] 8.36% | 11,458 | 50.1% |
[ 9.0% - 9.5% ] 9.17% | 1,669 | 52.0% |
[ 10.0% - 10.5% ] 10.10% | 5,476 | 53.5% |
[ 11.0% - 11.5% ] 11.04% | 1,857 | 60.1% |
[ 11.5% - 12.0% ] 11.91% | 235 | 57.9% |
[ 12.0% - 12.5% ] 12.16% | 148 | 77.4% |
[ 29.0% - 29.5% ] 29.41% | 34 | 35.7% |