Turkish College, 1 year or more

COMPARE

Turkish
Race
Ancestry
AfghanAfricanAlaska NativeAlaskan AthabascanAlbanianAleutAlsatianAmericanApacheArabArapahoArgentineanArmenianAssyrian/Chaldean/SyriacAustralianAustrianBahamianBangladeshiBarbadianBasqueBelgianBelizeanBermudanBhutaneseBlackfeetBolivianBrazilianBritishBritish West IndianBulgarianBurmeseCajunCambodianCanadianCape VerdeanCarpatho RusynCelticCentral AmericanCentral American IndianCherokeeCheyenneChickasawChileanChineseChippewaChoctawColombianColvilleComancheCosta RicanCreeCreekCroatianCrowCubanCypriotCzechCzechoslovakianDanishDelawareDominicanDutchDutch West IndianEastern EuropeanEcuadorianEgyptianEnglishEstonianEthiopianEuropeanFijianFilipinoFinnishFrenchFrench American IndianFrench CanadianGermanGerman RussianGhanaianGreekGuamanian/ChamorroGuatemalanGuyaneseHaitianHmongHonduranHopiHoumaHungarianIcelanderIndian (Asian)IndonesianInupiatIranianIraqiIrishIroquoisIsraeliItalianJamaicanJapaneseJordanianKenyanKiowaKoreanLaotianLatvianLebaneseLiberianLithuanianLumbeeLuxembourgerMacedonianMalaysianMalteseMarshalleseMenomineeMexicanMexican American IndianMongolianMoroccanNative HawaiianNavajoNepaleseNew ZealanderNicaraguanNigerianNorthern EuropeanNorwegianOkinawanOsageOttawaPaiutePakistaniPalestinianPanamanianParaguayanPennsylvania GermanPeruvianPimaPolishPortuguesePotawatomiPuebloPuerto RicanPuget Sound SalishRomanianRussianSalvadoranSamoanScandinavianScotch-IrishScottishSeminoleSenegaleseSerbianShoshoneSierra LeoneanSiouxSlavicSlovakSloveneSomaliSouth AfricanSouth AmericanSouth American IndianSoviet UnionSpaniardSpanishSpanish AmericanSpanish American IndianSri LankanSubsaharan AfricanSudaneseSwedishSwissSyrianTaiwaneseThaiTlingit-HaidaTohono O'OdhamTonganTrinidadian and TobagonianTsimshianTurkishU.S. Virgin IslanderUgandanUkrainianUruguayanUteVenezuelanVietnameseWelshWest IndianYakamaYaquiYugoslavianYumanYup'ikZimbabwean
Immigration
NonimmigrantsImmigrantsAfghanistanAfricaAlbaniaArgentinaArmeniaAsiaAustraliaAustriaBahamasBangladeshBarbadosBelarusBelgiumBelizeBoliviaBosnia and HerzegovinaBrazilBulgariaBurma/MyanmarCabo VerdeCambodiaCameroonCanadaCaribbeanCentral AmericaChileChinaColombiaCongoCosta RicaCroatiaCubaCzechoslovakiaDenmarkDominicaDominican RepublicEastern AfricaEastern AsiaEastern EuropeEcuadorEgyptEl SalvadorEnglandEritreaEthiopiaEuropeFijiFranceGermanyGhanaGreeceGrenadaGuatemalaGuyanaHaitiHondurasHong KongHungaryIndiaIndonesiaIranIraqIrelandIsraelItalyJamaicaJapanJordanKazakhstanKenyaKoreaKuwaitLaosLatin AmericaLatviaLebanonLiberiaLithuaniaMalaysiaMexicoMicronesiaMiddle AfricaMoldovaMoroccoNepalNetherlandsNicaraguaNigeriaNorth AmericaNorth MacedoniaNorthern AfricaNorthern EuropeNorwayOceaniaPakistanPanamaPeruPhilippinesPolandPortugalRomaniaRussiaSaudi ArabiaScotlandSenegalSerbiaSierra LeoneSingaporeSomaliaSouth AfricaSouth AmericaSouth Central AsiaSouth Eastern AsiaSouthern EuropeSpainSri LankaSt. Vincent and the GrenadinesSudanSwedenSwitzerlandSyriaTaiwanThailandTrinidad and TobagoTurkeyUgandaUkraineUruguayUzbekistanVenezuelaVietnamWest IndiesWestern AfricaWestern AsiaWestern EuropeYemenZaireZimbabweAzores
Select to Compare
Race
Ancestry
AfghanAfricanAlaska NativeAlaskan AthabascanAlbanianAleutAlsatianAmericanApacheArabArapahoArgentineanArmenianAssyrian/Chaldean/SyriacAustralianAustrianBahamianBangladeshiBarbadianBasqueBelgianBelizeanBermudanBhutaneseBlackfeetBolivianBrazilianBritishBritish West IndianBulgarianBurmeseCajunCambodianCanadianCape VerdeanCarpatho RusynCelticCentral AmericanCentral American IndianCherokeeCheyenneChickasawChileanChineseChippewaChoctawColombianColvilleComancheCosta RicanCreeCreekCroatianCrowCubanCypriotCzechCzechoslovakianDanishDelawareDominicanDutchDutch West IndianEastern EuropeanEcuadorianEgyptianEnglishEstonianEthiopianEuropeanFijianFilipinoFinnishFrenchFrench American IndianFrench CanadianGermanGerman RussianGhanaianGreekGuamanian/ChamorroGuatemalanGuyaneseHaitianHmongHonduranHopiHoumaHungarianIcelanderIndian (Asian)IndonesianInupiatIranianIraqiIrishIroquoisIsraeliItalianJamaicanJapaneseJordanianKenyanKiowaKoreanLaotianLatvianLebaneseLiberianLithuanianLumbeeLuxembourgerMacedonianMalaysianMalteseMarshalleseMenomineeMexicanMexican American IndianMongolianMoroccanNative HawaiianNavajoNepaleseNew ZealanderNicaraguanNigerianNorthern EuropeanNorwegianOkinawanOsageOttawaPaiutePakistaniPalestinianPanamanianParaguayanPennsylvania GermanPeruvianPimaPolishPortuguesePotawatomiPuebloPuerto RicanPuget Sound SalishRomanianRussianSalvadoranSamoanScandinavianScotch-IrishScottishSeminoleSenegaleseSerbianShoshoneSierra LeoneanSiouxSlavicSlovakSloveneSomaliSouth AfricanSouth AmericanSouth American IndianSoviet UnionSpaniardSpanishSpanish AmericanSpanish American IndianSri LankanSubsaharan AfricanSudaneseSwedishSwissSyrianTaiwaneseThaiTlingit-HaidaTohono O'OdhamTonganTrinidadian and TobagonianTsimshianU.S. Virgin IslanderUgandanUkrainianUruguayanUteVenezuelanVietnameseWelshWest IndianYakamaYaquiYugoslavianYumanYup'ikZimbabwean
Immigration
NonimmigrantsImmigrantsAfghanistanAfricaAlbaniaArgentinaArmeniaAsiaAustraliaAustriaBahamasBangladeshBarbadosBelarusBelgiumBelizeBoliviaBosnia and HerzegovinaBrazilBulgariaBurma/MyanmarCabo VerdeCambodiaCameroonCanadaCaribbeanCentral AmericaChileChinaColombiaCongoCosta RicaCroatiaCubaCzechoslovakiaDenmarkDominicaDominican RepublicEastern AfricaEastern AsiaEastern EuropeEcuadorEgyptEl SalvadorEnglandEritreaEthiopiaEuropeFijiFranceGermanyGhanaGreeceGrenadaGuatemalaGuyanaHaitiHondurasHong KongHungaryIndiaIndonesiaIranIraqIrelandIsraelItalyJamaicaJapanJordanKazakhstanKenyaKoreaKuwaitLaosLatin AmericaLatviaLebanonLiberiaLithuaniaMalaysiaMexicoMicronesiaMiddle AfricaMoldovaMoroccoNepalNetherlandsNicaraguaNigeriaNorth AmericaNorth MacedoniaNorthern AfricaNorthern EuropeNorwayOceaniaPakistanPanamaPeruPhilippinesPolandPortugalRomaniaRussiaSaudi ArabiaScotlandSenegalSerbiaSierra LeoneSingaporeSomaliaSouth AfricaSouth AmericaSouth Central AsiaSouth Eastern AsiaSouthern EuropeSpainSri LankaSt. Vincent and the GrenadinesSudanSwedenSwitzerlandSyriaTaiwanThailandTrinidad and TobagoTurkeyUgandaUkraineUruguayUzbekistanVenezuelaVietnamWest IndiesWestern AfricaWestern AsiaWestern EuropeYemenZaireZimbabweAzores
College, 1 year or more
Income
Poverty
Unemployment
Labor Participation
Family Structure
Vehicle Availability
Education Level
Disability

Turkish College, 1 year or more
Exceptional

65.5%
COLLEGE, 1 YEAR OR MORE
100.0/ 100
METRIC RATING
31st/ 347
METRIC RANK

Turkish College, 1 year or more Correlation Chart

The statistical analysis conducted on geographies consisting of 271,864,133 people shows a slight positive correlation between the proportion of Turks and percentage of population with at least college, 1 year or more education in the United States with a correlation coefficient (R) of 0.091 and weighted average of 65.5%. On average, for every 1% (one percent) increase in Turks within a typical geography, there is an increase of 0.24% in percentage of population with at least college, 1 year or more education.
Turkish College, 1 year or more
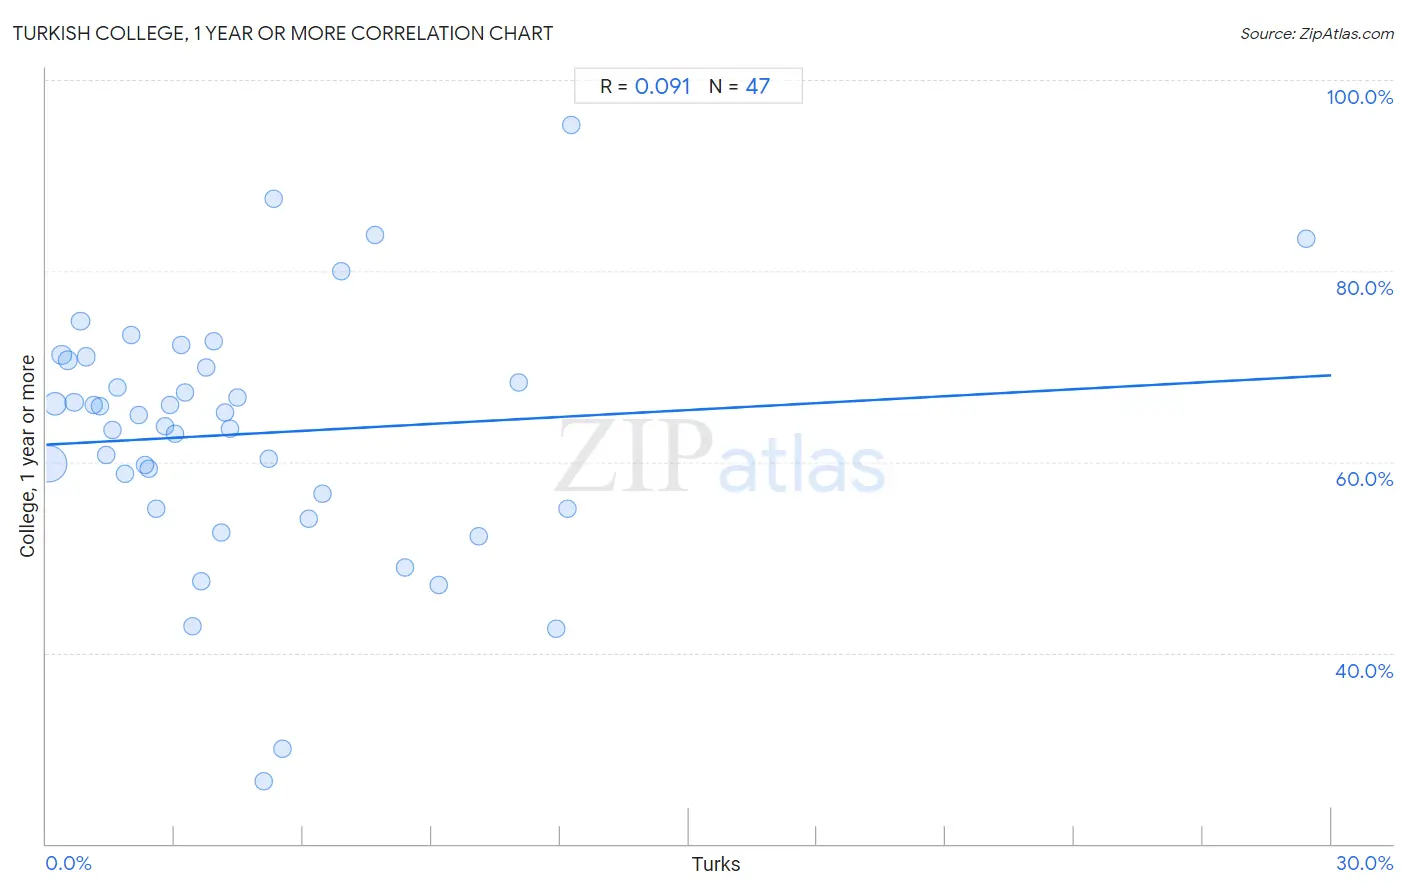
It is essential to understand that the correlation between the percentage of Turks and percentage of population with at least college, 1 year or more education does not imply a direct cause-and-effect relationship. It remains uncertain whether the presence of Turks influences an upward or downward trend in the level of percentage of population with at least college, 1 year or more education within an area, or if Turks simply ended up residing in those areas with higher or lower levels of percentage of population with at least college, 1 year or more education due to other factors.

Demographics Similar to Turks by College, 1 year or more

In terms of college, 1 year or more, the demographic groups most similar to Turks are Bulgarian (65.5%, a difference of 0.050%), Immigrants from Denmark (65.6%, a difference of 0.080%), Immigrants from Northern Europe (65.6%, a difference of 0.19%), Immigrants from Sri Lanka (65.4%, a difference of 0.20%), and Israeli (65.3%, a difference of 0.32%).
DemographicsRating | RankCollege, 1 year or more
Immigrants from Belgium
100.0
/100
|
#24
Exceptional
66.3%
Indians (Asian)
100.0
/100
|
#25
Exceptional
66.1%
Latvians
100.0
/100
|
#26
Exceptional
66.1%
Immigrants from Ireland
100.0
/100
|
#27
Exceptional
65.9%
Immigrants from France
100.0
/100
|
#28
Exceptional
65.8%
Immigrants from Northern Europe
100.0
/100
|
#29
Exceptional
65.6%
Immigrants from Denmark
100.0
/100
|
#30
Exceptional
65.6%
Turks
100.0
/100
|
#31
Exceptional
65.5%
Bulgarians
100.0
/100
|
#32
Exceptional
65.5%
Immigrants from Sri Lanka
99.9
/100
|
#33
Exceptional
65.4%
Israelis
99.9
/100
|
#34
Exceptional
65.3%
Immigrants from Turkey
99.9
/100
|
#35
Exceptional
65.2%
Immigrants from South Africa
99.9
/100
|
#36
Exceptional
65.1%
Russians
99.9
/100
|
#37
Exceptional
65.1%
Immigrants from Saudi Arabia
99.9
/100
|
#38
Exceptional
65.0%

Turkish College, 1 year or more Correlation Summary

MeasurementTurkish DataCollege, 1 year or more Data
Minimum0.061%26.5%
Maximum29.4%95.2%
Range29.4%68.7%
Mean4.7%63.0%
Median3.4%64.9%
Interquartile 25% (IQ1)1.7%55.1%
Interquartile 75% (IQ3)6.1%70.6%
Interquartile Range (IQR)4.5%15.5%
Standard Deviation (Sample)5.0%13.2%
Standard Deviation (Population)4.9%13.1%

Correlation Details

Turkish PercentileSample SizeCollege, 1 year or more
[
0.0%
-
0.5%
]
0.061%
189,254,70159.8%
[
0.0%
-
0.5%
]
0.20%
49,241,06766.0%
[
0.0%
-
0.5%
]
0.36%
14,871,96571.2%
[
0.5%
-
1.0%
]
0.51%
7,043,28370.6%
[
0.5%
-
1.0%
]
0.65%
3,926,51466.2%
[
0.5%
-
1.0%
]
0.80%
2,298,83374.7%
[
0.5%
-
1.0%
]
0.94%
1,523,45971.0%
[
1.0%
-
1.5%
]
1.11%
754,31466.0%
[
1.0%
-
1.5%
]
1.25%
612,68065.9%
[
1.0%
-
1.5%
]
1.40%
451,62160.7%
[
1.5%
-
2.0%
]
1.54%
542,50663.3%
[
1.5%
-
2.0%
]
1.66%
261,79767.8%
[
1.5%
-
2.0%
]
1.83%
294,86858.7%
[
1.5%
-
2.0%
]
1.98%
148,58873.3%
[
2.0%
-
2.5%
]
2.16%
97,19764.9%
[
2.0%
-
2.5%
]
2.31%
67,36559.7%
[
2.0%
-
2.5%
]
2.40%
61,94259.3%
[
2.5%
-
3.0%
]
2.56%
50,19055.1%
[
2.5%
-
3.0%
]
2.77%
33,54863.7%
[
2.5%
-
3.0%
]
2.88%
54,28766.0%
[
3.0%
-
3.5%
]
3.01%
52,38963.0%
[
3.0%
-
3.5%
]
3.16%
3,61172.3%
[
3.0%
-
3.5%
]
3.25%
17,34067.2%
[
3.0%
-
3.5%
]
3.42%
1,31442.8%
[
3.5%
-
4.0%
]
3.62%
33,60947.5%
[
3.5%
-
4.0%
]
3.73%
31,78169.9%
[
3.5%
-
4.0%
]
3.90%
13,39472.6%
[
4.0%
-
4.5%
]
4.10%
11,62352.7%
[
4.0%
-
4.5%
]
4.18%
26,82965.2%
[
4.0%
-
4.5%
]
4.29%
19,28763.5%
[
4.0%
-
4.5%
]
4.47%
10,89766.8%
[
5.0%
-
5.5%
]
5.08%
5926.5%
[
5.0%
-
5.5%
]
5.19%
1,46360.4%
[
5.0%
-
5.5%
]
5.30%
43487.5%
[
5.5%
-
6.0%
]
5.51%
38130.0%
[
6.0%
-
6.5%
]
6.13%
1,61654.0%
[
6.0%
-
6.5%
]
6.44%
21,95056.7%
[
6.5%
-
7.0%
]
6.90%
2980.0%
[
7.5%
-
8.0%
]
7.66%
4,15083.8%
[
8.0%
-
8.5%
]
8.36%
11,45848.9%
[
9.0%
-
9.5%
]
9.17%
1,66947.1%
[
10.0%
-
10.5%
]
10.10%
5,47652.2%
[
11.0%
-
11.5%
]
11.04%
1,85768.4%
[
11.5%
-
12.0%
]
11.91%
23542.5%
[
12.0%
-
12.5%
]
12.16%
14855.1%
[
12.0%
-
12.5%
]
12.27%
37595.2%
[
29.0%
-
29.5%
]
29.41%
3483.3%