Soviet Union Married-Couple Family Poverty
COMPARE
Soviet Union
Select to Compare
Married-Couple Family Poverty
Soviet Union Married-Couple Family Poverty
4.9%
POVERTY | MARRIED-COUPLE FAMILIES
90.7/ 100
METRIC RATING
130th/ 347
METRIC RANK
Soviet Union Married-Couple Family Poverty Correlation Chart
The statistical analysis conducted on geographies consisting of 43,419,717 people shows a poor negative correlation between the proportion of Soviet Union and poverty level among married-couple families in the United States with a correlation coefficient (R) of -0.166 and weighted average of 4.9%. On average, for every 1% (one percent) increase in Soviet Union within a typical geography, there is a decrease of 1.8% in poverty level among married-couple families.
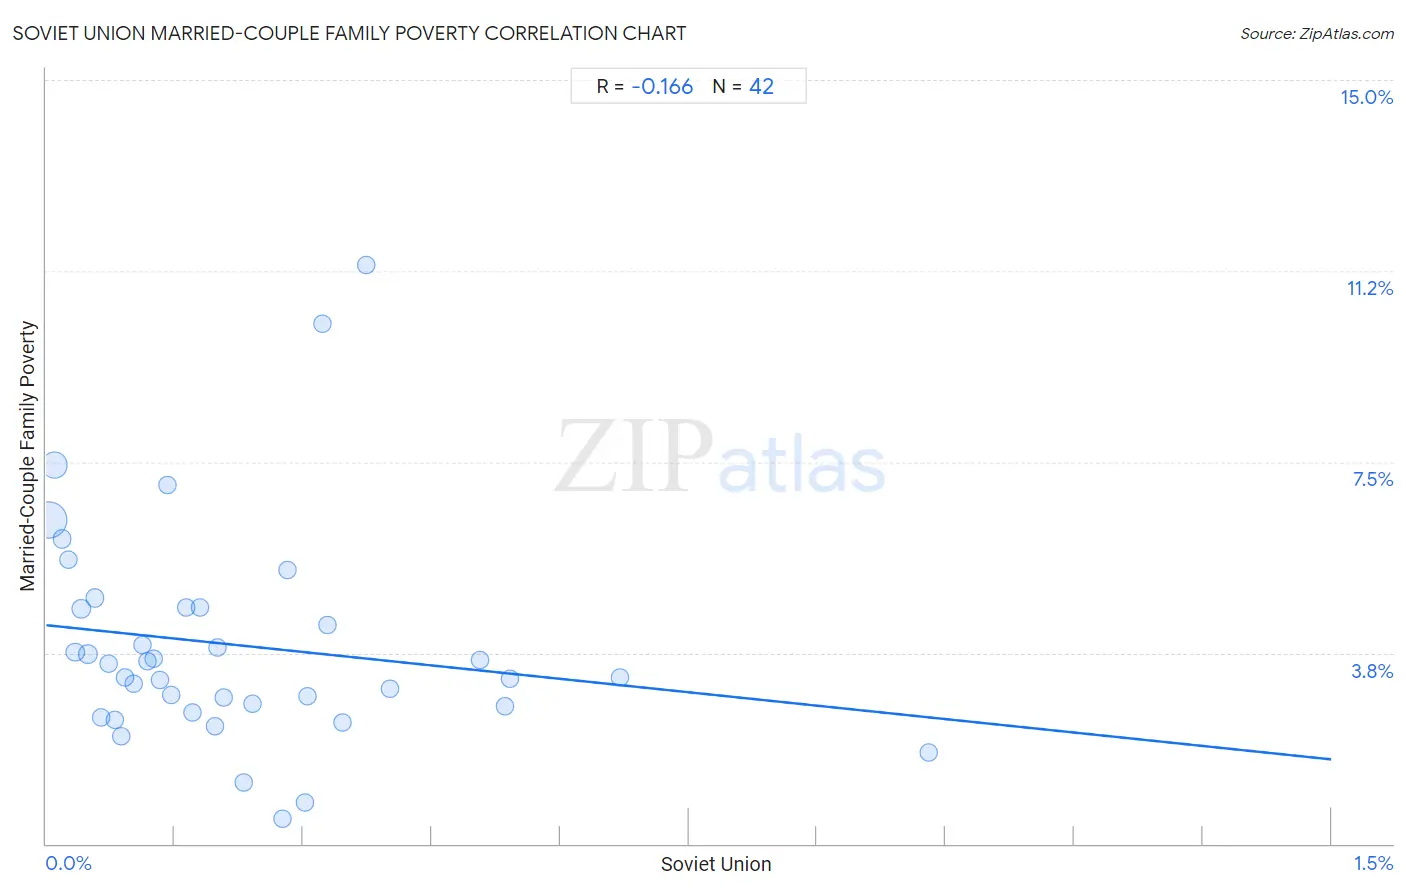
It is essential to understand that the correlation between the percentage of Soviet Union and poverty level among married-couple families does not imply a direct cause-and-effect relationship. It remains uncertain whether the presence of Soviet Union influences an upward or downward trend in the level of poverty level among married-couple families within an area, or if Soviet Union simply ended up residing in those areas with higher or lower levels of poverty level among married-couple families due to other factors.
Demographics Similar to Soviet Union by Married-Couple Family Poverty
In terms of married-couple family poverty, the demographic groups most similar to Soviet Union are Immigrants from Pakistan (4.9%, a difference of 0.010%), Immigrants from Eastern Europe (4.9%, a difference of 0.070%), Puget Sound Salish (4.9%, a difference of 0.080%), Immigrants from Kenya (4.9%, a difference of 0.15%), and Samoan (4.9%, a difference of 0.16%).
| Demographics | Rating | Rank | Married-Couple Family Poverty |
| Jordanians | 93.1 /100 | #123 | Exceptional 4.8% |
| Romanians | 92.5 /100 | #124 | Exceptional 4.8% |
| Immigrants from Bosnia and Herzegovina | 92.5 /100 | #125 | Exceptional 4.8% |
| Immigrants from Asia | 92.3 /100 | #126 | Exceptional 4.8% |
| Egyptians | 92.0 /100 | #127 | Exceptional 4.8% |
| Palestinians | 91.2 /100 | #128 | Exceptional 4.9% |
| Immigrants from Pakistan | 90.7 /100 | #129 | Exceptional 4.9% |
| Soviet Union | 90.7 /100 | #130 | Exceptional 4.9% |
| Immigrants from Eastern Europe | 90.5 /100 | #131 | Exceptional 4.9% |
| Puget Sound Salish | 90.4 /100 | #132 | Exceptional 4.9% |
| Immigrants from Kenya | 90.2 /100 | #133 | Exceptional 4.9% |
| Samoans | 90.2 /100 | #134 | Exceptional 4.9% |
| Assyrians/Chaldeans/Syriacs | 89.4 /100 | #135 | Excellent 4.9% |
| Immigrants from Hungary | 88.7 /100 | #136 | Excellent 4.9% |
| Guamanians/Chamorros | 86.5 /100 | #137 | Excellent 4.9% |
Soviet Union Married-Couple Family Poverty Correlation Summary
| Measurement | Soviet Union Data | Married-Couple Family Poverty Data |
| Minimum | 0.0032% | 0.48% |
| Maximum | 1.0% | 11.4% |
| Range | 1.0% | 10.9% |
| Mean | 0.22% | 3.9% |
| Median | 0.17% | 3.4% |
| Interquartile 25% (IQ1) | 0.080% | 2.7% |
| Interquartile 75% (IQ3) | 0.31% | 4.6% |
| Interquartile Range (IQR) | 0.23% | 1.9% |
| Standard Deviation (Sample) | 0.21% | 2.2% |
| Standard Deviation (Population) | 0.20% | 2.1% |
Correlation Details
| Soviet Union Percentile | Sample Size | Married-Couple Family Poverty |
[ 0.0% - 0.5% ] 0.0032% | 24,703,913 | 6.4% |
[ 0.0% - 0.5% ] 0.0095% | 11,258,323 | 7.4% |
[ 0.0% - 0.5% ] 0.018% | 1,054,867 | 6.0% |
[ 0.0% - 0.5% ] 0.026% | 864,752 | 5.6% |
[ 0.0% - 0.5% ] 0.034% | 932,942 | 3.8% |
[ 0.0% - 0.5% ] 0.040% | 1,513,924 | 4.6% |
[ 0.0% - 0.5% ] 0.049% | 675,377 | 3.7% |
[ 0.0% - 0.5% ] 0.056% | 355,817 | 4.8% |
[ 0.0% - 0.5% ] 0.064% | 277,085 | 2.5% |
[ 0.0% - 0.5% ] 0.073% | 255,733 | 3.5% |
[ 0.0% - 0.5% ] 0.080% | 327,945 | 2.4% |
[ 0.0% - 0.5% ] 0.088% | 27,211 | 2.1% |
[ 0.0% - 0.5% ] 0.092% | 41,440 | 3.3% |
[ 0.0% - 0.5% ] 0.10% | 151,094 | 3.2% |
[ 0.0% - 0.5% ] 0.11% | 95,613 | 3.9% |
[ 0.0% - 0.5% ] 0.12% | 72,834 | 3.6% |
[ 0.0% - 0.5% ] 0.12% | 104,995 | 3.6% |
[ 0.0% - 0.5% ] 0.13% | 112,905 | 3.2% |
[ 0.0% - 0.5% ] 0.14% | 34,048 | 7.1% |
[ 0.0% - 0.5% ] 0.15% | 71,909 | 2.9% |
[ 0.0% - 0.5% ] 0.16% | 2,453 | 4.6% |
[ 0.0% - 0.5% ] 0.17% | 123,337 | 2.6% |
[ 0.0% - 0.5% ] 0.18% | 6,127 | 4.6% |
[ 0.0% - 0.5% ] 0.20% | 32,537 | 2.3% |
[ 0.0% - 0.5% ] 0.20% | 7,979 | 3.9% |
[ 0.0% - 0.5% ] 0.21% | 22,630 | 2.9% |
[ 0.0% - 0.5% ] 0.23% | 23,445 | 1.2% |
[ 0.0% - 0.5% ] 0.24% | 9,156 | 2.7% |
[ 0.0% - 0.5% ] 0.28% | 6,517 | 0.48% |
[ 0.0% - 0.5% ] 0.28% | 10,302 | 5.4% |
[ 0.0% - 0.5% ] 0.30% | 8,943 | 0.81% |
[ 0.0% - 0.5% ] 0.31% | 27,171 | 2.9% |
[ 0.0% - 0.5% ] 0.32% | 81,109 | 10.2% |
[ 0.0% - 0.5% ] 0.33% | 20,411 | 4.3% |
[ 0.0% - 0.5% ] 0.35% | 4,041 | 2.4% |
[ 0.0% - 0.5% ] 0.37% | 5,897 | 11.4% |
[ 0.0% - 0.5% ] 0.40% | 9,975 | 3.0% |
[ 0.5% - 1.0% ] 0.51% | 8,298 | 3.6% |
[ 0.5% - 1.0% ] 0.54% | 15,497 | 2.7% |
[ 0.5% - 1.0% ] 0.54% | 27,514 | 3.3% |
[ 0.5% - 1.0% ] 0.67% | 26,565 | 3.3% |
[ 1.0% - 1.5% ] 1.03% | 7,086 | 1.8% |