Soviet Union Married-couple Households
COMPARE
Soviet Union
Select to Compare
Married-couple Households
Soviet Union Married-couple Households
44.6%
MARRIED-COUPLE HOUSEHOLDS
1.6/ 100
METRIC RATING
230th/ 347
METRIC RANK
Soviet Union Married-couple Households Correlation Chart
The statistical analysis conducted on geographies consisting of 43,509,630 people shows a slight positive correlation between the proportion of Soviet Union and percentage of married-couple family households in the United States with a correlation coefficient (R) of 0.078 and weighted average of 44.6%. On average, for every 1% (one percent) increase in Soviet Union within a typical geography, there is an increase of 3.5% in percentage of married-couple family households.
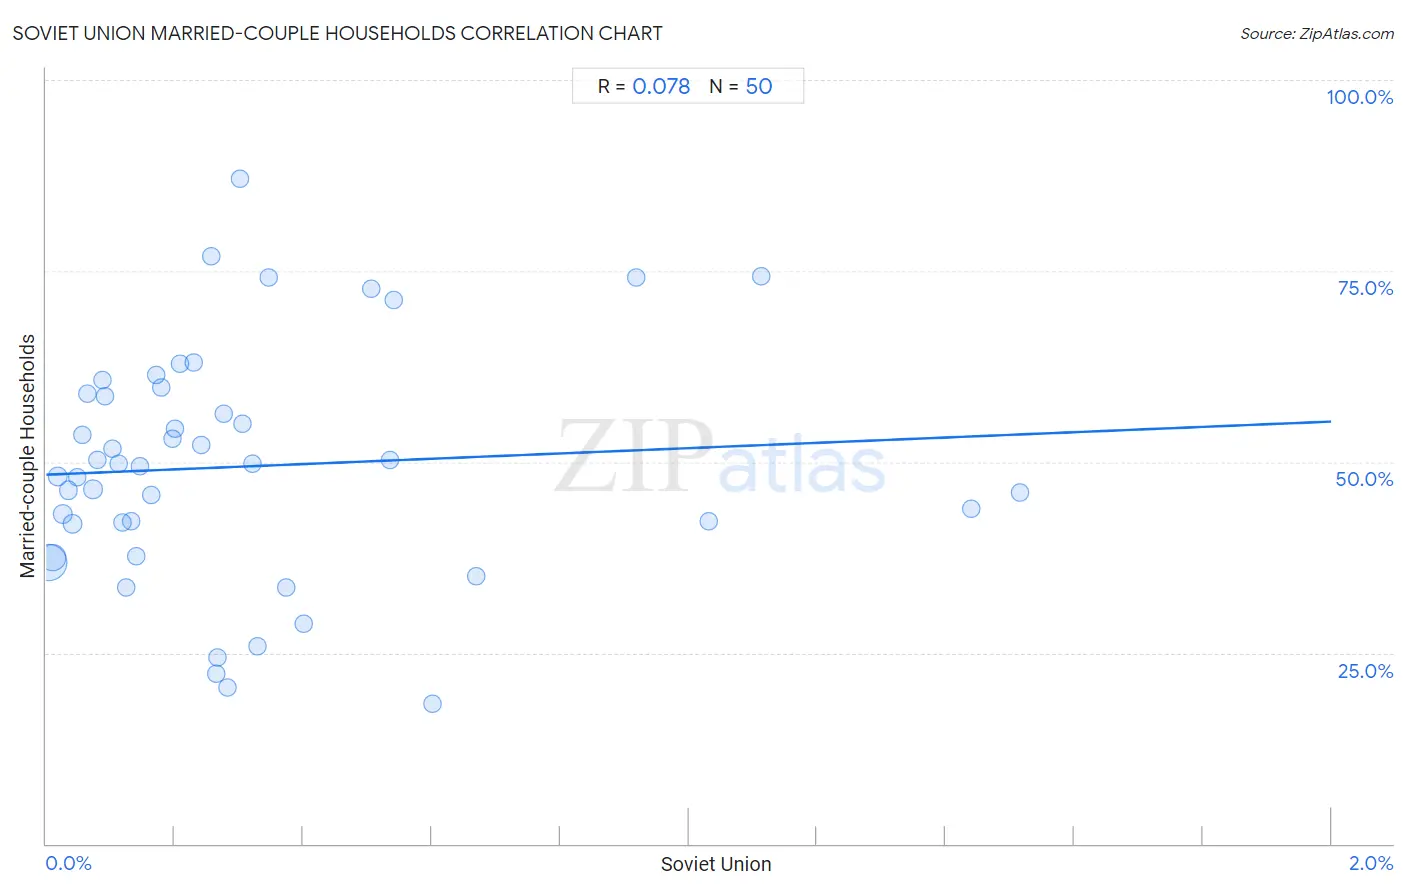
It is essential to understand that the correlation between the percentage of Soviet Union and percentage of married-couple family households does not imply a direct cause-and-effect relationship. It remains uncertain whether the presence of Soviet Union influences an upward or downward trend in the level of percentage of married-couple family households within an area, or if Soviet Union simply ended up residing in those areas with higher or lower levels of percentage of married-couple family households due to other factors.
Demographics Similar to Soviet Union by Married-couple Households
In terms of married-couple households, the demographic groups most similar to Soviet Union are Houma (44.6%, a difference of 0.010%), Marshallese (44.6%, a difference of 0.010%), Immigrants from Latin America (44.7%, a difference of 0.040%), Immigrants from Uganda (44.6%, a difference of 0.050%), and Kenyan (44.7%, a difference of 0.090%).
| Demographics | Rating | Rank | Married-couple Households |
| Immigrants from Cambodia | 2.7 /100 | #223 | Tragic 44.9% |
| Immigrants from Micronesia | 2.6 /100 | #224 | Tragic 44.9% |
| Dutch West Indians | 2.6 /100 | #225 | Tragic 44.9% |
| Alsatians | 2.3 /100 | #226 | Tragic 44.8% |
| Salvadorans | 1.9 /100 | #227 | Tragic 44.7% |
| Kenyans | 1.7 /100 | #228 | Tragic 44.7% |
| Immigrants from Latin America | 1.6 /100 | #229 | Tragic 44.7% |
| Soviet Union | 1.6 /100 | #230 | Tragic 44.6% |
| Houma | 1.5 /100 | #231 | Tragic 44.6% |
| Marshallese | 1.5 /100 | #232 | Tragic 44.6% |
| Immigrants from Uganda | 1.5 /100 | #233 | Tragic 44.6% |
| Immigrants from Panama | 1.3 /100 | #234 | Tragic 44.6% |
| Immigrants from Nicaragua | 1.2 /100 | #235 | Tragic 44.5% |
| Yaqui | 1.2 /100 | #236 | Tragic 44.5% |
| Comanche | 1.2 /100 | #237 | Tragic 44.5% |
Soviet Union Married-couple Households Correlation Summary
| Measurement | Soviet Union Data | Married-couple Households Data |
| Minimum | 0.0032% | 18.4% |
| Maximum | 1.5% | 87.0% |
| Range | 1.5% | 68.6% |
| Mean | 0.31% | 49.4% |
| Median | 0.20% | 49.6% |
| Interquartile 25% (IQ1) | 0.092% | 41.9% |
| Interquartile 75% (IQ3) | 0.35% | 58.9% |
| Interquartile Range (IQR) | 0.25% | 17.0% |
| Standard Deviation (Sample) | 0.35% | 15.5% |
| Standard Deviation (Population) | 0.34% | 15.3% |
Correlation Details
| Soviet Union Percentile | Sample Size | Married-couple Households |
[ 0.0% - 0.5% ] 0.0032% | 24,703,913 | 36.8% |
[ 0.0% - 0.5% ] 0.0095% | 11,258,323 | 37.4% |
[ 0.0% - 0.5% ] 0.018% | 1,054,867 | 48.1% |
[ 0.0% - 0.5% ] 0.026% | 864,752 | 43.2% |
[ 0.0% - 0.5% ] 0.034% | 932,942 | 46.2% |
[ 0.0% - 0.5% ] 0.040% | 1,513,924 | 41.9% |
[ 0.0% - 0.5% ] 0.049% | 675,377 | 48.0% |
[ 0.0% - 0.5% ] 0.056% | 355,817 | 53.5% |
[ 0.0% - 0.5% ] 0.064% | 277,085 | 58.9% |
[ 0.0% - 0.5% ] 0.073% | 255,733 | 46.4% |
[ 0.0% - 0.5% ] 0.080% | 327,945 | 50.3% |
[ 0.0% - 0.5% ] 0.088% | 27,211 | 60.6% |
[ 0.0% - 0.5% ] 0.092% | 41,440 | 58.5% |
[ 0.0% - 0.5% ] 0.10% | 151,094 | 51.8% |
[ 0.0% - 0.5% ] 0.11% | 95,613 | 49.8% |
[ 0.0% - 0.5% ] 0.12% | 72,834 | 42.0% |
[ 0.0% - 0.5% ] 0.12% | 104,995 | 33.6% |
[ 0.0% - 0.5% ] 0.13% | 112,905 | 42.2% |
[ 0.0% - 0.5% ] 0.14% | 34,048 | 37.6% |
[ 0.0% - 0.5% ] 0.15% | 71,909 | 49.4% |
[ 0.0% - 0.5% ] 0.16% | 2,453 | 45.6% |
[ 0.0% - 0.5% ] 0.17% | 123,337 | 61.4% |
[ 0.0% - 0.5% ] 0.18% | 6,127 | 59.7% |
[ 0.0% - 0.5% ] 0.20% | 32,537 | 53.0% |
[ 0.0% - 0.5% ] 0.20% | 7,979 | 54.3% |
[ 0.0% - 0.5% ] 0.21% | 22,630 | 62.9% |
[ 0.0% - 0.5% ] 0.23% | 23,445 | 63.0% |
[ 0.0% - 0.5% ] 0.24% | 9,156 | 52.2% |
[ 0.0% - 0.5% ] 0.26% | 6,625 | 76.9% |
[ 0.0% - 0.5% ] 0.26% | 2,653 | 22.3% |
[ 0.0% - 0.5% ] 0.27% | 60,231 | 24.4% |
[ 0.0% - 0.5% ] 0.28% | 6,517 | 56.2% |
[ 0.0% - 0.5% ] 0.28% | 10,302 | 20.4% |
[ 0.0% - 0.5% ] 0.30% | 8,943 | 87.0% |
[ 0.0% - 0.5% ] 0.31% | 27,171 | 55.0% |
[ 0.0% - 0.5% ] 0.32% | 81,109 | 49.7% |
[ 0.0% - 0.5% ] 0.33% | 20,411 | 25.9% |
[ 0.0% - 0.5% ] 0.35% | 4,041 | 74.1% |
[ 0.0% - 0.5% ] 0.37% | 5,897 | 33.6% |
[ 0.0% - 0.5% ] 0.40% | 9,975 | 28.8% |
[ 0.5% - 1.0% ] 0.51% | 8,298 | 72.6% |
[ 0.5% - 1.0% ] 0.54% | 15,497 | 50.2% |
[ 0.5% - 1.0% ] 0.54% | 27,514 | 71.1% |
[ 0.5% - 1.0% ] 0.60% | 16,808 | 18.4% |
[ 0.5% - 1.0% ] 0.67% | 26,565 | 35.0% |
[ 0.5% - 1.0% ] 0.92% | 2,067 | 74.2% |
[ 1.0% - 1.5% ] 1.03% | 7,086 | 42.2% |
[ 1.0% - 1.5% ] 1.11% | 1,258 | 74.3% |
[ 1.0% - 1.5% ] 1.44% | 139 | 43.9% |
[ 1.5% - 2.0% ] 1.52% | 132 | 46.0% |