Soviet Union College, Under 1 year

COMPARE

Soviet Union
Race
Ancestry
AfghanAfricanAlaska NativeAlaskan AthabascanAlbanianAleutAlsatianAmericanApacheArabArapahoArgentineanArmenianAssyrian/Chaldean/SyriacAustralianAustrianBahamianBangladeshiBarbadianBasqueBelgianBelizeanBermudanBhutaneseBlackfeetBolivianBrazilianBritishBritish West IndianBulgarianBurmeseCajunCambodianCanadianCape VerdeanCarpatho RusynCelticCentral AmericanCentral American IndianCherokeeCheyenneChickasawChileanChineseChippewaChoctawColombianColvilleComancheCosta RicanCreeCreekCroatianCrowCubanCypriotCzechCzechoslovakianDanishDelawareDominicanDutchDutch West IndianEastern EuropeanEcuadorianEgyptianEnglishEstonianEthiopianEuropeanFijianFilipinoFinnishFrenchFrench American IndianFrench CanadianGermanGerman RussianGhanaianGreekGuamanian/ChamorroGuatemalanGuyaneseHaitianHmongHonduranHopiHoumaHungarianIcelanderIndian (Asian)IndonesianInupiatIranianIraqiIrishIroquoisIsraeliItalianJamaicanJapaneseJordanianKenyanKiowaKoreanLaotianLatvianLebaneseLiberianLithuanianLumbeeLuxembourgerMacedonianMalaysianMalteseMarshalleseMenomineeMexicanMexican American IndianMongolianMoroccanNative HawaiianNavajoNepaleseNew ZealanderNicaraguanNigerianNorthern EuropeanNorwegianOkinawanOsageOttawaPaiutePakistaniPalestinianPanamanianParaguayanPennsylvania GermanPeruvianPimaPolishPortuguesePotawatomiPuebloPuerto RicanPuget Sound SalishRomanianRussianSalvadoranSamoanScandinavianScotch-IrishScottishSeminoleSenegaleseSerbianShoshoneSierra LeoneanSiouxSlavicSlovakSloveneSomaliSouth AfricanSouth AmericanSouth American IndianSoviet UnionSpaniardSpanishSpanish AmericanSpanish American IndianSri LankanSubsaharan AfricanSudaneseSwedishSwissSyrianTaiwaneseThaiTlingit-HaidaTohono O'OdhamTonganTrinidadian and TobagonianTsimshianTurkishU.S. Virgin IslanderUgandanUkrainianUruguayanUteVenezuelanVietnameseWelshWest IndianYakamaYaquiYugoslavianYumanYup'ikZimbabwean
Immigration
NonimmigrantsImmigrantsAfghanistanAfricaAlbaniaArgentinaArmeniaAsiaAustraliaAustriaBahamasBangladeshBarbadosBelarusBelgiumBelizeBoliviaBosnia and HerzegovinaBrazilBulgariaBurma/MyanmarCabo VerdeCambodiaCameroonCanadaCaribbeanCentral AmericaChileChinaColombiaCongoCosta RicaCroatiaCubaCzechoslovakiaDenmarkDominicaDominican RepublicEastern AfricaEastern AsiaEastern EuropeEcuadorEgyptEl SalvadorEnglandEritreaEthiopiaEuropeFijiFranceGermanyGhanaGreeceGrenadaGuatemalaGuyanaHaitiHondurasHong KongHungaryIndiaIndonesiaIranIraqIrelandIsraelItalyJamaicaJapanJordanKazakhstanKenyaKoreaKuwaitLaosLatin AmericaLatviaLebanonLiberiaLithuaniaMalaysiaMexicoMicronesiaMiddle AfricaMoldovaMoroccoNepalNetherlandsNicaraguaNigeriaNorth AmericaNorth MacedoniaNorthern AfricaNorthern EuropeNorwayOceaniaPakistanPanamaPeruPhilippinesPolandPortugalRomaniaRussiaSaudi ArabiaScotlandSenegalSerbiaSierra LeoneSingaporeSomaliaSouth AfricaSouth AmericaSouth Central AsiaSouth Eastern AsiaSouthern EuropeSpainSri LankaSt. Vincent and the GrenadinesSudanSwedenSwitzerlandSyriaTaiwanThailandTrinidad and TobagoTurkeyUgandaUkraineUruguayUzbekistanVenezuelaVietnamWest IndiesWestern AfricaWestern AsiaWestern EuropeYemenZaireZimbabweAzores
Select to Compare
Race
Ancestry
AfghanAfricanAlaska NativeAlaskan AthabascanAlbanianAleutAlsatianAmericanApacheArabArapahoArgentineanArmenianAssyrian/Chaldean/SyriacAustralianAustrianBahamianBangladeshiBarbadianBasqueBelgianBelizeanBermudanBhutaneseBlackfeetBolivianBrazilianBritishBritish West IndianBulgarianBurmeseCajunCambodianCanadianCape VerdeanCarpatho RusynCelticCentral AmericanCentral American IndianCherokeeCheyenneChickasawChileanChineseChippewaChoctawColombianColvilleComancheCosta RicanCreeCreekCroatianCrowCubanCypriotCzechCzechoslovakianDanishDelawareDominicanDutchDutch West IndianEastern EuropeanEcuadorianEgyptianEnglishEstonianEthiopianEuropeanFijianFilipinoFinnishFrenchFrench American IndianFrench CanadianGermanGerman RussianGhanaianGreekGuamanian/ChamorroGuatemalanGuyaneseHaitianHmongHonduranHopiHoumaHungarianIcelanderIndian (Asian)IndonesianInupiatIranianIraqiIrishIroquoisIsraeliItalianJamaicanJapaneseJordanianKenyanKiowaKoreanLaotianLatvianLebaneseLiberianLithuanianLumbeeLuxembourgerMacedonianMalaysianMalteseMarshalleseMenomineeMexicanMexican American IndianMongolianMoroccanNative HawaiianNavajoNepaleseNew ZealanderNicaraguanNigerianNorthern EuropeanNorwegianOkinawanOsageOttawaPaiutePakistaniPalestinianPanamanianParaguayanPennsylvania GermanPeruvianPimaPolishPortuguesePotawatomiPuebloPuerto RicanPuget Sound SalishRomanianRussianSalvadoranSamoanScandinavianScotch-IrishScottishSeminoleSenegaleseSerbianShoshoneSierra LeoneanSiouxSlavicSlovakSloveneSomaliSouth AfricanSouth AmericanSouth American IndianSpaniardSpanishSpanish AmericanSpanish American IndianSri LankanSubsaharan AfricanSudaneseSwedishSwissSyrianTaiwaneseThaiTlingit-HaidaTohono O'OdhamTonganTrinidadian and TobagonianTsimshianTurkishU.S. Virgin IslanderUgandanUkrainianUruguayanUteVenezuelanVietnameseWelshWest IndianYakamaYaquiYugoslavianYumanYup'ikZimbabwean
Immigration
NonimmigrantsImmigrantsAfghanistanAfricaAlbaniaArgentinaArmeniaAsiaAustraliaAustriaBahamasBangladeshBarbadosBelarusBelgiumBelizeBoliviaBosnia and HerzegovinaBrazilBulgariaBurma/MyanmarCabo VerdeCambodiaCameroonCanadaCaribbeanCentral AmericaChileChinaColombiaCongoCosta RicaCroatiaCubaCzechoslovakiaDenmarkDominicaDominican RepublicEastern AfricaEastern AsiaEastern EuropeEcuadorEgyptEl SalvadorEnglandEritreaEthiopiaEuropeFijiFranceGermanyGhanaGreeceGrenadaGuatemalaGuyanaHaitiHondurasHong KongHungaryIndiaIndonesiaIranIraqIrelandIsraelItalyJamaicaJapanJordanKazakhstanKenyaKoreaKuwaitLaosLatin AmericaLatviaLebanonLiberiaLithuaniaMalaysiaMexicoMicronesiaMiddle AfricaMoldovaMoroccoNepalNetherlandsNicaraguaNigeriaNorth AmericaNorth MacedoniaNorthern AfricaNorthern EuropeNorwayOceaniaPakistanPanamaPeruPhilippinesPolandPortugalRomaniaRussiaSaudi ArabiaScotlandSenegalSerbiaSierra LeoneSingaporeSomaliaSouth AfricaSouth AmericaSouth Central AsiaSouth Eastern AsiaSouthern EuropeSpainSri LankaSt. Vincent and the GrenadinesSudanSwedenSwitzerlandSyriaTaiwanThailandTrinidad and TobagoTurkeyUgandaUkraineUruguayUzbekistanVenezuelaVietnamWest IndiesWestern AfricaWestern AsiaWestern EuropeYemenZaireZimbabweAzores
College, Under 1 year
Income
Poverty
Unemployment
Labor Participation
Family Structure
Vehicle Availability
Education Level
Disability

Soviet Union College, Under 1 year
Exceptional

71.1%
COLLEGE, UNDER 1 YEAR
100.0/ 100
METRIC RATING
24th/ 347
METRIC RANK

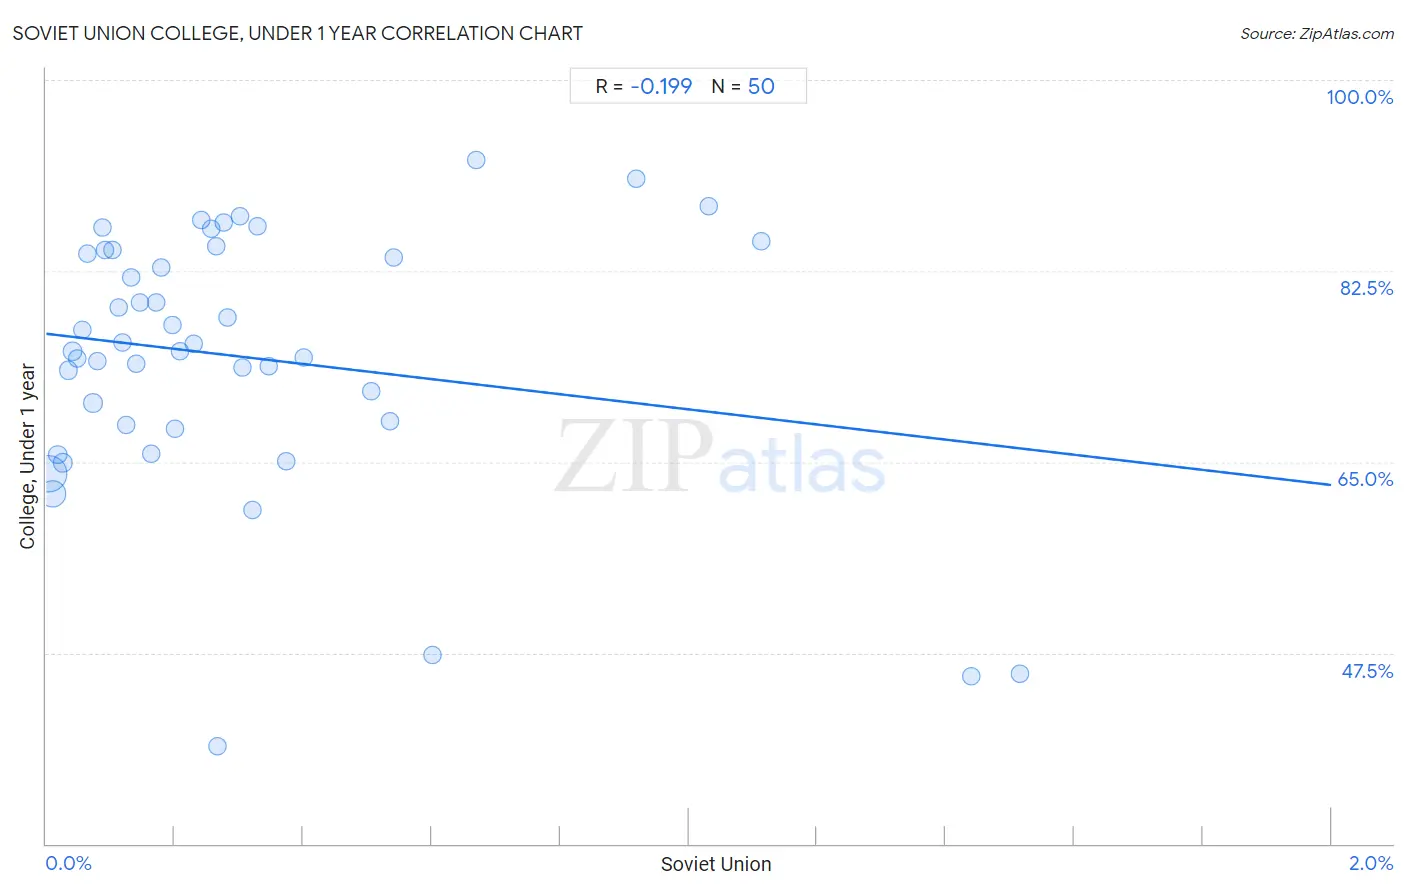
Soviet Union College, Under 1 year Correlation Chart

The statistical analysis conducted on geographies consisting of 43,514,626 people shows a poor negative correlation between the proportion of Soviet Union and percentage of population with at least college, under 1 year education in the United States with a correlation coefficient (R) of -0.199 and weighted average of 71.1%. On average, for every 1% (one percent) increase in Soviet Union within a typical geography, there is a decrease of 6.9% in percentage of population with at least college, under 1 year education.
Soviet Union College, Under 1 year
It is essential to understand that the correlation between the percentage of Soviet Union and percentage of population with at least college, under 1 year education does not imply a direct cause-and-effect relationship. It remains uncertain whether the presence of Soviet Union influences an upward or downward trend in the level of percentage of population with at least college, under 1 year education within an area, or if Soviet Union simply ended up residing in those areas with higher or lower levels of percentage of population with at least college, under 1 year education due to other factors.

Demographics Similar to Soviet Union by College, Under 1 year

In terms of college, under 1 year, the demographic groups most similar to Soviet Union are Immigrants from Northern Europe (71.1%, a difference of 0.010%), Bulgarian (71.1%, a difference of 0.020%), Immigrants from Denmark (71.0%, a difference of 0.13%), Immigrants from Ireland (71.0%, a difference of 0.14%), and Immigrants from Hong Kong (71.0%, a difference of 0.17%).
DemographicsRating | RankCollege, Under 1 year
Eastern Europeans
100.0
/100
|
#17
Exceptional
71.8%
Immigrants from Switzerland
100.0
/100
|
#18
Exceptional
71.7%
Latvians
100.0
/100
|
#19
Exceptional
71.6%
Immigrants from Korea
100.0
/100
|
#20
Exceptional
71.6%
Immigrants from Belgium
100.0
/100
|
#21
Exceptional
71.5%
Immigrants from Eastern Asia
100.0
/100
|
#22
Exceptional
71.3%
Immigrants from Northern Europe
100.0
/100
|
#23
Exceptional
71.1%
Soviet Union
100.0
/100
|
#24
Exceptional
71.1%
Bulgarians
100.0
/100
|
#25
Exceptional
71.1%
Immigrants from Denmark
100.0
/100
|
#26
Exceptional
71.0%
Immigrants from Ireland
100.0
/100
|
#27
Exceptional
71.0%
Immigrants from Hong Kong
100.0
/100
|
#28
Exceptional
71.0%
Immigrants from France
100.0
/100
|
#29
Exceptional
71.0%
Immigrants from China
99.9
/100
|
#30
Exceptional
70.9%
Indians (Asian)
99.9
/100
|
#31
Exceptional
70.8%

Soviet Union College, Under 1 year Correlation Summary

MeasurementSoviet Union DataCollege, Under 1 year Data
Minimum0.0032%39.0%
Maximum1.5%92.7%
Range1.5%53.7%
Mean0.31%74.6%
Median0.20%75.5%
Interquartile 25% (IQ1)0.092%68.4%
Interquartile 75% (IQ3)0.35%84.4%
Interquartile Range (IQR)0.25%16.0%
Standard Deviation (Sample)0.35%12.1%
Standard Deviation (Population)0.34%12.0%

Correlation Details

Soviet Union PercentileSample SizeCollege, Under 1 year
[
0.0%
-
0.5%
]
0.0032%
24,703,91363.9%
[
0.0%
-
0.5%
]
0.0095%
11,258,32362.0%
[
0.0%
-
0.5%
]
0.018%
1,054,86765.7%
[
0.0%
-
0.5%
]
0.026%
864,75264.9%
[
0.0%
-
0.5%
]
0.034%
932,94273.4%
[
0.0%
-
0.5%
]
0.040%
1,513,92475.1%
[
0.0%
-
0.5%
]
0.049%
675,37774.5%
[
0.0%
-
0.5%
]
0.056%
355,81777.1%
[
0.0%
-
0.5%
]
0.064%
277,08584.1%
[
0.0%
-
0.5%
]
0.073%
255,73370.4%
[
0.0%
-
0.5%
]
0.080%
327,94574.2%
[
0.0%
-
0.5%
]
0.088%
27,21186.5%
[
0.0%
-
0.5%
]
0.092%
41,44084.5%
[
0.0%
-
0.5%
]
0.10%
156,09084.4%
[
0.0%
-
0.5%
]
0.11%
95,61379.2%
[
0.0%
-
0.5%
]
0.12%
72,83475.9%
[
0.0%
-
0.5%
]
0.12%
104,99568.4%
[
0.0%
-
0.5%
]
0.13%
112,90581.9%
[
0.0%
-
0.5%
]
0.14%
34,04874.0%
[
0.0%
-
0.5%
]
0.15%
71,90979.6%
[
0.0%
-
0.5%
]
0.16%
2,45365.7%
[
0.0%
-
0.5%
]
0.17%
123,33779.7%
[
0.0%
-
0.5%
]
0.18%
6,12782.8%
[
0.0%
-
0.5%
]
0.20%
32,53777.6%
[
0.0%
-
0.5%
]
0.20%
7,97968.1%
[
0.0%
-
0.5%
]
0.21%
22,63075.1%
[
0.0%
-
0.5%
]
0.23%
23,44575.8%
[
0.0%
-
0.5%
]
0.24%
9,15687.2%
[
0.0%
-
0.5%
]
0.26%
6,62586.3%
[
0.0%
-
0.5%
]
0.26%
2,65384.7%
[
0.0%
-
0.5%
]
0.27%
60,23139.0%
[
0.0%
-
0.5%
]
0.28%
6,51786.9%
[
0.0%
-
0.5%
]
0.28%
10,30278.2%
[
0.0%
-
0.5%
]
0.30%
8,94387.5%
[
0.0%
-
0.5%
]
0.31%
27,17173.7%
[
0.0%
-
0.5%
]
0.32%
81,10960.6%
[
0.0%
-
0.5%
]
0.33%
20,41186.6%
[
0.0%
-
0.5%
]
0.35%
4,04173.8%
[
0.0%
-
0.5%
]
0.37%
5,89765.1%
[
0.0%
-
0.5%
]
0.40%
9,97574.6%
[
0.5%
-
1.0%
]
0.51%
8,29871.5%
[
0.5%
-
1.0%
]
0.54%
15,49768.7%
[
0.5%
-
1.0%
]
0.54%
27,51483.7%
[
0.5%
-
1.0%
]
0.60%
16,80847.3%
[
0.5%
-
1.0%
]
0.67%
26,56592.7%
[
0.5%
-
1.0%
]
0.92%
2,06790.9%
[
1.0%
-
1.5%
]
1.03%
7,08688.5%
[
1.0%
-
1.5%
]
1.11%
1,25885.2%
[
1.0%
-
1.5%
]
1.44%
13945.4%
[
1.5%
-
2.0%
]
1.52%
13245.6%