Soviet Union Wage/Income Gap

COMPARE

Soviet Union
Race
Ancestry
AfghanAfricanAlaska NativeAlaskan AthabascanAlbanianAleutAlsatianAmericanApacheArabArapahoArgentineanArmenianAssyrian/Chaldean/SyriacAustralianAustrianBahamianBangladeshiBarbadianBasqueBelgianBelizeanBermudanBhutaneseBlackfeetBolivianBrazilianBritishBritish West IndianBulgarianBurmeseCajunCambodianCanadianCape VerdeanCarpatho RusynCelticCentral AmericanCentral American IndianCherokeeCheyenneChickasawChileanChineseChippewaChoctawColombianColvilleComancheCosta RicanCreeCreekCroatianCrowCubanCypriotCzechCzechoslovakianDanishDelawareDominicanDutchDutch West IndianEastern EuropeanEcuadorianEgyptianEnglishEstonianEthiopianEuropeanFijianFilipinoFinnishFrenchFrench American IndianFrench CanadianGermanGerman RussianGhanaianGreekGuamanian/ChamorroGuatemalanGuyaneseHaitianHmongHonduranHopiHoumaHungarianIcelanderIndian (Asian)IndonesianInupiatIranianIraqiIrishIroquoisIsraeliItalianJamaicanJapaneseJordanianKenyanKiowaKoreanLaotianLatvianLebaneseLiberianLithuanianLumbeeLuxembourgerMacedonianMalaysianMalteseMarshalleseMenomineeMexicanMexican American IndianMongolianMoroccanNative HawaiianNavajoNepaleseNew ZealanderNicaraguanNigerianNorthern EuropeanNorwegianOkinawanOsageOttawaPaiutePakistaniPalestinianPanamanianParaguayanPennsylvania GermanPeruvianPimaPolishPortuguesePotawatomiPuebloPuerto RicanPuget Sound SalishRomanianRussianSalvadoranSamoanScandinavianScotch-IrishScottishSeminoleSenegaleseSerbianShoshoneSierra LeoneanSiouxSlavicSlovakSloveneSomaliSouth AfricanSouth AmericanSouth American IndianSoviet UnionSpaniardSpanishSpanish AmericanSpanish American IndianSri LankanSubsaharan AfricanSudaneseSwedishSwissSyrianTaiwaneseThaiTlingit-HaidaTohono O'OdhamTonganTrinidadian and TobagonianTsimshianTurkishU.S. Virgin IslanderUgandanUkrainianUruguayanUteVenezuelanVietnameseWelshWest IndianYakamaYaquiYugoslavianYumanYup'ikZimbabwean
Immigration
NonimmigrantsImmigrantsAfghanistanAfricaAlbaniaArgentinaArmeniaAsiaAustraliaAustriaBahamasBangladeshBarbadosBelarusBelgiumBelizeBoliviaBosnia and HerzegovinaBrazilBulgariaBurma/MyanmarCabo VerdeCambodiaCameroonCanadaCaribbeanCentral AmericaChileChinaColombiaCongoCosta RicaCroatiaCubaCzechoslovakiaDenmarkDominicaDominican RepublicEastern AfricaEastern AsiaEastern EuropeEcuadorEgyptEl SalvadorEnglandEritreaEthiopiaEuropeFijiFranceGermanyGhanaGreeceGrenadaGuatemalaGuyanaHaitiHondurasHong KongHungaryIndiaIndonesiaIranIraqIrelandIsraelItalyJamaicaJapanJordanKazakhstanKenyaKoreaKuwaitLaosLatin AmericaLatviaLebanonLiberiaLithuaniaMalaysiaMexicoMicronesiaMiddle AfricaMoldovaMoroccoNepalNetherlandsNicaraguaNigeriaNorth AmericaNorth MacedoniaNorthern AfricaNorthern EuropeNorwayOceaniaPakistanPanamaPeruPhilippinesPolandPortugalRomaniaRussiaSaudi ArabiaScotlandSenegalSerbiaSierra LeoneSingaporeSomaliaSouth AfricaSouth AmericaSouth Central AsiaSouth Eastern AsiaSouthern EuropeSpainSri LankaSt. Vincent and the GrenadinesSudanSwedenSwitzerlandSyriaTaiwanThailandTrinidad and TobagoTurkeyUgandaUkraineUruguayUzbekistanVenezuelaVietnamWest IndiesWestern AfricaWestern AsiaWestern EuropeYemenZaireZimbabweAzores
Select to Compare
Race
Ancestry
AfghanAfricanAlaska NativeAlaskan AthabascanAlbanianAleutAlsatianAmericanApacheArabArapahoArgentineanArmenianAssyrian/Chaldean/SyriacAustralianAustrianBahamianBangladeshiBarbadianBasqueBelgianBelizeanBermudanBhutaneseBlackfeetBolivianBrazilianBritishBritish West IndianBulgarianBurmeseCajunCambodianCanadianCape VerdeanCarpatho RusynCelticCentral AmericanCentral American IndianCherokeeCheyenneChickasawChileanChineseChippewaChoctawColombianColvilleComancheCosta RicanCreeCreekCroatianCrowCubanCypriotCzechCzechoslovakianDanishDelawareDominicanDutchDutch West IndianEastern EuropeanEcuadorianEgyptianEnglishEstonianEthiopianEuropeanFijianFilipinoFinnishFrenchFrench American IndianFrench CanadianGermanGerman RussianGhanaianGreekGuamanian/ChamorroGuatemalanGuyaneseHaitianHmongHonduranHopiHoumaHungarianIcelanderIndian (Asian)IndonesianInupiatIranianIraqiIrishIroquoisIsraeliItalianJamaicanJapaneseJordanianKenyanKiowaKoreanLaotianLatvianLebaneseLiberianLithuanianLumbeeLuxembourgerMacedonianMalaysianMalteseMarshalleseMenomineeMexicanMexican American IndianMongolianMoroccanNative HawaiianNavajoNepaleseNew ZealanderNicaraguanNigerianNorthern EuropeanNorwegianOkinawanOsageOttawaPaiutePakistaniPalestinianPanamanianParaguayanPennsylvania GermanPeruvianPimaPolishPortuguesePotawatomiPuebloPuerto RicanPuget Sound SalishRomanianRussianSalvadoranSamoanScandinavianScotch-IrishScottishSeminoleSenegaleseSerbianShoshoneSierra LeoneanSiouxSlavicSlovakSloveneSomaliSouth AfricanSouth AmericanSouth American IndianSpaniardSpanishSpanish AmericanSpanish American IndianSri LankanSubsaharan AfricanSudaneseSwedishSwissSyrianTaiwaneseThaiTlingit-HaidaTohono O'OdhamTonganTrinidadian and TobagonianTsimshianTurkishU.S. Virgin IslanderUgandanUkrainianUruguayanUteVenezuelanVietnameseWelshWest IndianYakamaYaquiYugoslavianYumanYup'ikZimbabwean
Immigration
NonimmigrantsImmigrantsAfghanistanAfricaAlbaniaArgentinaArmeniaAsiaAustraliaAustriaBahamasBangladeshBarbadosBelarusBelgiumBelizeBoliviaBosnia and HerzegovinaBrazilBulgariaBurma/MyanmarCabo VerdeCambodiaCameroonCanadaCaribbeanCentral AmericaChileChinaColombiaCongoCosta RicaCroatiaCubaCzechoslovakiaDenmarkDominicaDominican RepublicEastern AfricaEastern AsiaEastern EuropeEcuadorEgyptEl SalvadorEnglandEritreaEthiopiaEuropeFijiFranceGermanyGhanaGreeceGrenadaGuatemalaGuyanaHaitiHondurasHong KongHungaryIndiaIndonesiaIranIraqIrelandIsraelItalyJamaicaJapanJordanKazakhstanKenyaKoreaKuwaitLaosLatin AmericaLatviaLebanonLiberiaLithuaniaMalaysiaMexicoMicronesiaMiddle AfricaMoldovaMoroccoNepalNetherlandsNicaraguaNigeriaNorth AmericaNorth MacedoniaNorthern AfricaNorthern EuropeNorwayOceaniaPakistanPanamaPeruPhilippinesPolandPortugalRomaniaRussiaSaudi ArabiaScotlandSenegalSerbiaSierra LeoneSingaporeSomaliaSouth AfricaSouth AmericaSouth Central AsiaSouth Eastern AsiaSouthern EuropeSpainSri LankaSt. Vincent and the GrenadinesSudanSwedenSwitzerlandSyriaTaiwanThailandTrinidad and TobagoTurkeyUgandaUkraineUruguayUzbekistanVenezuelaVietnamWest IndiesWestern AfricaWestern AsiaWestern EuropeYemenZaireZimbabweAzores
Wage/Income Gap
Income
Poverty
Unemployment
Labor Participation
Family Structure
Vehicle Availability
Education Level
Disability

Soviet Union Wage/Income Gap
Exceptional

24.2%
WAGE/INCOME GAP
97.6/ 100
METRIC RATING
111th/ 347
METRIC RANK

Soviet Union Wage/Income Gap Correlation Chart

The statistical analysis conducted on geographies consisting of 43,506,320 people shows no correlation between the proportion of Soviet Union and wage/income gap percentage in the United States with a correlation coefficient (R) of 0.027 and weighted average of 24.2%. On average, for every 1% (one percent) increase in Soviet Union within a typical geography, there is an increase of 1.1% in wage/income gap percentage.
Soviet Union Wage/Income Gap
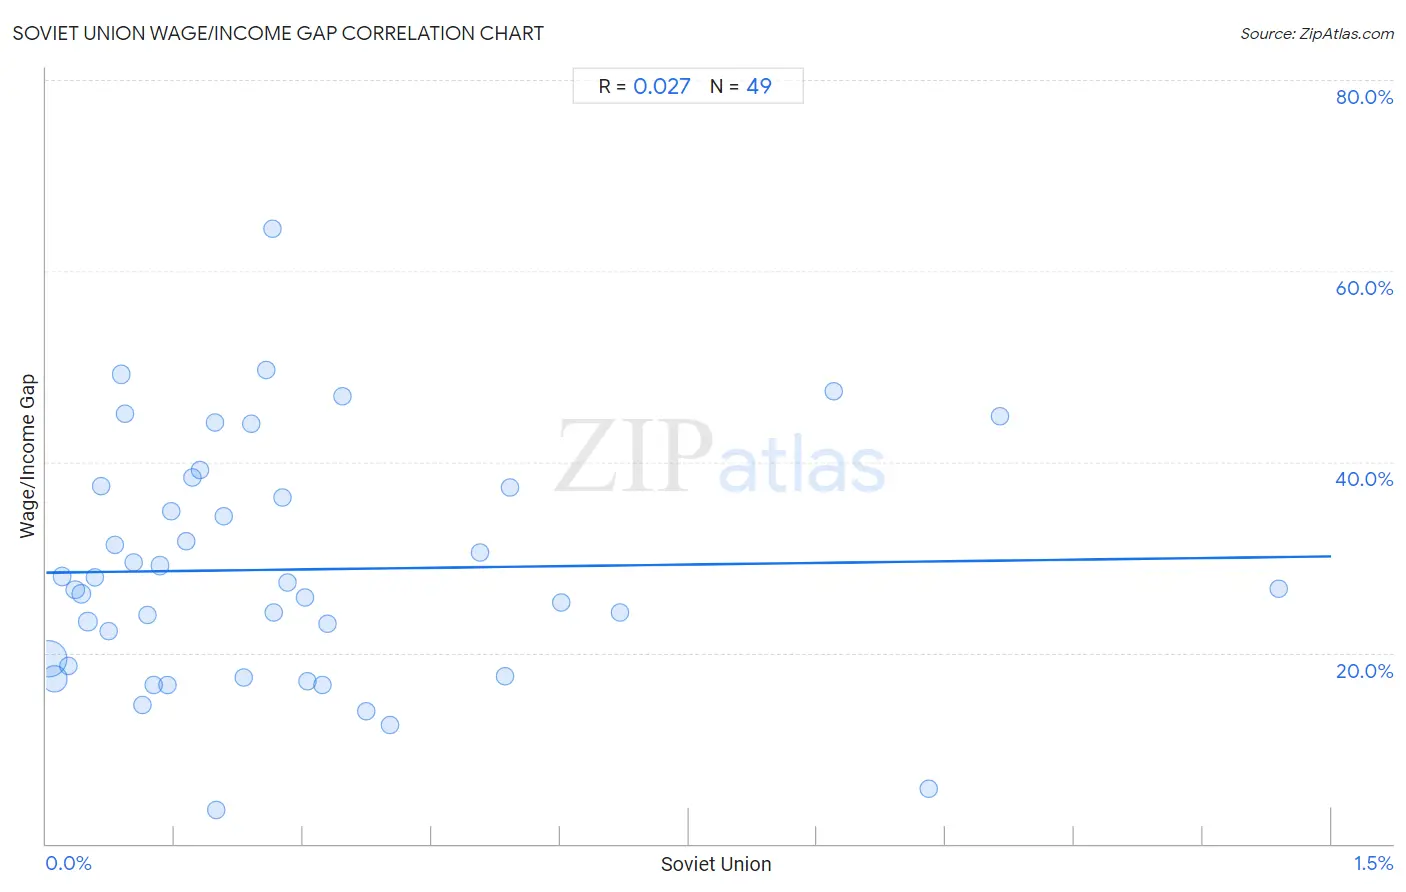
It is essential to understand that the correlation between the percentage of Soviet Union and wage/income gap percentage does not imply a direct cause-and-effect relationship. It remains uncertain whether the presence of Soviet Union influences an upward or downward trend in the level of wage/income gap percentage within an area, or if Soviet Union simply ended up residing in those areas with higher or lower levels of wage/income gap percentage due to other factors.

Demographics Similar to Soviet Union by Wage/Income Gap

In terms of wage/income gap, the demographic groups most similar to Soviet Union are Immigrants from Colombia (24.3%, a difference of 0.40%), Immigrants from Morocco (24.1%, a difference of 0.44%), Sioux (24.3%, a difference of 0.45%), Panamanian (24.4%, a difference of 0.65%), and Ugandan (24.1%, a difference of 0.66%).
DemographicsRating | RankWage/Income Gap
Tlingit-Haida
98.7
/100
|
#104
Exceptional
24.0%
Moroccans
98.6
/100
|
#105
Exceptional
24.0%
Sudanese
98.6
/100
|
#106
Exceptional
24.0%
Yaqui
98.4
/100
|
#107
Exceptional
24.0%
Immigrants from Albania
98.4
/100
|
#108
Exceptional
24.0%
Ugandans
98.3
/100
|
#109
Exceptional
24.1%
Immigrants from Morocco
98.1
/100
|
#110
Exceptional
24.1%
Soviet Union
97.6
/100
|
#111
Exceptional
24.2%
Immigrants from Colombia
97.0
/100
|
#112
Exceptional
24.3%
Sioux
96.9
/100
|
#113
Exceptional
24.3%
Panamanians
96.5
/100
|
#114
Exceptional
24.4%
Immigrants from Kenya
96.4
/100
|
#115
Exceptional
24.4%
Alaska Natives
96.0
/100
|
#116
Exceptional
24.4%
Immigrants from Afghanistan
95.9
/100
|
#117
Exceptional
24.4%
Immigrants from Micronesia
95.8
/100
|
#118
Exceptional
24.4%

Soviet Union Wage/Income Gap Correlation Summary

MeasurementSoviet Union DataWage/Income Gap Data
Minimum0.0032%3.5%
Maximum1.4%64.4%
Range1.4%60.9%
Mean0.29%28.7%
Median0.20%26.8%
Interquartile 25% (IQ1)0.090%18.1%
Interquartile 75% (IQ3)0.34%37.4%
Interquartile Range (IQR)0.25%19.3%
Standard Deviation (Sample)0.30%12.5%
Standard Deviation (Population)0.30%12.4%

Correlation Details

Soviet Union PercentileSample SizeWage/Income Gap
[
0.0%
-
0.5%
]
0.0032%
24,703,91319.4%
[
0.0%
-
0.5%
]
0.0095%
11,258,32317.3%
[
0.0%
-
0.5%
]
0.018%
1,054,86728.0%
[
0.0%
-
0.5%
]
0.026%
864,75218.6%
[
0.0%
-
0.5%
]
0.034%
932,94226.6%
[
0.0%
-
0.5%
]
0.040%
1,513,92426.2%
[
0.0%
-
0.5%
]
0.049%
675,37723.3%
[
0.0%
-
0.5%
]
0.056%
355,81727.9%
[
0.0%
-
0.5%
]
0.064%
277,08537.4%
[
0.0%
-
0.5%
]
0.073%
255,73322.3%
[
0.0%
-
0.5%
]
0.080%
327,94531.3%
[
0.0%
-
0.5%
]
0.088%
27,21149.2%
[
0.0%
-
0.5%
]
0.092%
41,44045.1%
[
0.0%
-
0.5%
]
0.10%
156,09029.5%
[
0.0%
-
0.5%
]
0.11%
95,61314.5%
[
0.0%
-
0.5%
]
0.12%
72,83424.0%
[
0.0%
-
0.5%
]
0.12%
104,99516.6%
[
0.0%
-
0.5%
]
0.13%
112,90529.1%
[
0.0%
-
0.5%
]
0.14%
34,04816.6%
[
0.0%
-
0.5%
]
0.15%
71,90934.8%
[
0.0%
-
0.5%
]
0.16%
2,45331.6%
[
0.0%
-
0.5%
]
0.17%
123,33738.3%
[
0.0%
-
0.5%
]
0.18%
6,12739.2%
[
0.0%
-
0.5%
]
0.20%
32,53744.1%
[
0.0%
-
0.5%
]
0.20%
3,5333.5%
[
0.0%
-
0.5%
]
0.21%
22,63034.3%
[
0.0%
-
0.5%
]
0.23%
23,44517.5%
[
0.0%
-
0.5%
]
0.24%
5,42843.9%
[
0.0%
-
0.5%
]
0.26%
6,62549.7%
[
0.0%
-
0.5%
]
0.26%
2,65364.4%
[
0.0%
-
0.5%
]
0.27%
60,23124.3%
[
0.0%
-
0.5%
]
0.28%
6,51736.3%
[
0.0%
-
0.5%
]
0.28%
10,30227.4%
[
0.0%
-
0.5%
]
0.30%
8,94325.8%
[
0.0%
-
0.5%
]
0.31%
27,17117.1%
[
0.0%
-
0.5%
]
0.32%
81,10916.6%
[
0.0%
-
0.5%
]
0.33%
20,41123.1%
[
0.0%
-
0.5%
]
0.35%
4,04146.9%
[
0.0%
-
0.5%
]
0.37%
5,89713.9%
[
0.0%
-
0.5%
]
0.40%
9,97512.4%
[
0.5%
-
1.0%
]
0.51%
8,29830.5%
[
0.5%
-
1.0%
]
0.54%
15,49717.5%
[
0.5%
-
1.0%
]
0.54%
27,51437.3%
[
0.5%
-
1.0%
]
0.60%
16,80825.3%
[
0.5%
-
1.0%
]
0.67%
26,56524.2%
[
0.5%
-
1.0%
]
0.92%
2,06747.4%
[
1.0%
-
1.5%
]
1.03%
7,0865.8%
[
1.0%
-
1.5%
]
1.11%
1,25844.7%
[
1.0%
-
1.5%
]
1.44%
13926.8%