Northern European 3 or more Vehicles in Household

COMPARE

Northern European
Race
Ancestry
AfghanAfricanAlaska NativeAlaskan AthabascanAlbanianAleutAlsatianAmericanApacheArabArapahoArgentineanArmenianAssyrian/Chaldean/SyriacAustralianAustrianBahamianBangladeshiBarbadianBasqueBelgianBelizeanBermudanBhutaneseBlackfeetBolivianBrazilianBritishBritish West IndianBulgarianBurmeseCajunCambodianCanadianCape VerdeanCarpatho RusynCelticCentral AmericanCentral American IndianCherokeeCheyenneChickasawChileanChineseChippewaChoctawColombianColvilleComancheCosta RicanCreeCreekCroatianCrowCubanCypriotCzechCzechoslovakianDanishDelawareDominicanDutchDutch West IndianEastern EuropeanEcuadorianEgyptianEnglishEstonianEthiopianEuropeanFijianFilipinoFinnishFrenchFrench American IndianFrench CanadianGermanGerman RussianGhanaianGreekGuamanian/ChamorroGuatemalanGuyaneseHaitianHmongHonduranHopiHoumaHungarianIcelanderIndian (Asian)IndonesianInupiatIranianIraqiIrishIroquoisIsraeliItalianJamaicanJapaneseJordanianKenyanKiowaKoreanLaotianLatvianLebaneseLiberianLithuanianLumbeeLuxembourgerMacedonianMalaysianMalteseMarshalleseMenomineeMexicanMexican American IndianMongolianMoroccanNative HawaiianNavajoNepaleseNew ZealanderNicaraguanNigerianNorthern EuropeanNorwegianOkinawanOsageOttawaPaiutePakistaniPalestinianPanamanianParaguayanPennsylvania GermanPeruvianPimaPolishPortuguesePotawatomiPuebloPuerto RicanPuget Sound SalishRomanianRussianSalvadoranSamoanScandinavianScotch-IrishScottishSeminoleSenegaleseSerbianShoshoneSierra LeoneanSiouxSlavicSlovakSloveneSomaliSouth AfricanSouth AmericanSouth American IndianSoviet UnionSpaniardSpanishSpanish AmericanSpanish American IndianSri LankanSubsaharan AfricanSudaneseSwedishSwissSyrianTaiwaneseThaiTlingit-HaidaTohono O'OdhamTonganTrinidadian and TobagonianTsimshianTurkishU.S. Virgin IslanderUgandanUkrainianUruguayanUteVenezuelanVietnameseWelshWest IndianYakamaYaquiYugoslavianYumanYup'ikZimbabwean
Immigration
NonimmigrantsImmigrantsAfghanistanAfricaAlbaniaArgentinaArmeniaAsiaAustraliaAustriaBahamasBangladeshBarbadosBelarusBelgiumBelizeBoliviaBosnia and HerzegovinaBrazilBulgariaBurma/MyanmarCabo VerdeCambodiaCameroonCanadaCaribbeanCentral AmericaChileChinaColombiaCongoCosta RicaCroatiaCubaCzechoslovakiaDenmarkDominicaDominican RepublicEastern AfricaEastern AsiaEastern EuropeEcuadorEgyptEl SalvadorEnglandEritreaEthiopiaEuropeFijiFranceGermanyGhanaGreeceGrenadaGuatemalaGuyanaHaitiHondurasHong KongHungaryIndiaIndonesiaIranIraqIrelandIsraelItalyJamaicaJapanJordanKazakhstanKenyaKoreaKuwaitLaosLatin AmericaLatviaLebanonLiberiaLithuaniaMalaysiaMexicoMicronesiaMiddle AfricaMoldovaMoroccoNepalNetherlandsNicaraguaNigeriaNorth AmericaNorth MacedoniaNorthern AfricaNorthern EuropeNorwayOceaniaPakistanPanamaPeruPhilippinesPolandPortugalRomaniaRussiaSaudi ArabiaScotlandSenegalSerbiaSierra LeoneSingaporeSomaliaSouth AfricaSouth AmericaSouth Central AsiaSouth Eastern AsiaSouthern EuropeSpainSri LankaSt. Vincent and the GrenadinesSudanSwedenSwitzerlandSyriaTaiwanThailandTrinidad and TobagoTurkeyUgandaUkraineUruguayUzbekistanVenezuelaVietnamWest IndiesWestern AfricaWestern AsiaWestern EuropeYemenZaireZimbabweAzores
Select to Compare
Race
Ancestry
AfghanAfricanAlaska NativeAlaskan AthabascanAlbanianAleutAlsatianAmericanApacheArabArapahoArgentineanArmenianAssyrian/Chaldean/SyriacAustralianAustrianBahamianBangladeshiBarbadianBasqueBelgianBelizeanBermudanBhutaneseBlackfeetBolivianBrazilianBritishBritish West IndianBulgarianBurmeseCajunCambodianCanadianCape VerdeanCarpatho RusynCelticCentral AmericanCentral American IndianCherokeeCheyenneChickasawChileanChineseChippewaChoctawColombianColvilleComancheCosta RicanCreeCreekCroatianCrowCubanCypriotCzechCzechoslovakianDanishDelawareDominicanDutchDutch West IndianEastern EuropeanEcuadorianEgyptianEnglishEstonianEthiopianEuropeanFijianFilipinoFinnishFrenchFrench American IndianFrench CanadianGermanGerman RussianGhanaianGreekGuamanian/ChamorroGuatemalanGuyaneseHaitianHmongHonduranHopiHoumaHungarianIcelanderIndian (Asian)IndonesianInupiatIranianIraqiIrishIroquoisIsraeliItalianJamaicanJapaneseJordanianKenyanKiowaKoreanLaotianLatvianLebaneseLiberianLithuanianLumbeeLuxembourgerMacedonianMalaysianMalteseMarshalleseMenomineeMexicanMexican American IndianMongolianMoroccanNative HawaiianNavajoNepaleseNew ZealanderNicaraguanNigerianNorwegianOkinawanOsageOttawaPaiutePakistaniPalestinianPanamanianParaguayanPennsylvania GermanPeruvianPimaPolishPortuguesePotawatomiPuebloPuerto RicanPuget Sound SalishRomanianRussianSalvadoranSamoanScandinavianScotch-IrishScottishSeminoleSenegaleseSerbianShoshoneSierra LeoneanSiouxSlavicSlovakSloveneSomaliSouth AfricanSouth AmericanSouth American IndianSoviet UnionSpaniardSpanishSpanish AmericanSpanish American IndianSri LankanSubsaharan AfricanSudaneseSwedishSwissSyrianTaiwaneseThaiTlingit-HaidaTohono O'OdhamTonganTrinidadian and TobagonianTsimshianTurkishU.S. Virgin IslanderUgandanUkrainianUruguayanUteVenezuelanVietnameseWelshWest IndianYakamaYaquiYugoslavianYumanYup'ikZimbabwean
Immigration
NonimmigrantsImmigrantsAfghanistanAfricaAlbaniaArgentinaArmeniaAsiaAustraliaAustriaBahamasBangladeshBarbadosBelarusBelgiumBelizeBoliviaBosnia and HerzegovinaBrazilBulgariaBurma/MyanmarCabo VerdeCambodiaCameroonCanadaCaribbeanCentral AmericaChileChinaColombiaCongoCosta RicaCroatiaCubaCzechoslovakiaDenmarkDominicaDominican RepublicEastern AfricaEastern AsiaEastern EuropeEcuadorEgyptEl SalvadorEnglandEritreaEthiopiaEuropeFijiFranceGermanyGhanaGreeceGrenadaGuatemalaGuyanaHaitiHondurasHong KongHungaryIndiaIndonesiaIranIraqIrelandIsraelItalyJamaicaJapanJordanKazakhstanKenyaKoreaKuwaitLaosLatin AmericaLatviaLebanonLiberiaLithuaniaMalaysiaMexicoMicronesiaMiddle AfricaMoldovaMoroccoNepalNetherlandsNicaraguaNigeriaNorth AmericaNorth MacedoniaNorthern AfricaNorthern EuropeNorwayOceaniaPakistanPanamaPeruPhilippinesPolandPortugalRomaniaRussiaSaudi ArabiaScotlandSenegalSerbiaSierra LeoneSingaporeSomaliaSouth AfricaSouth AmericaSouth Central AsiaSouth Eastern AsiaSouthern EuropeSpainSri LankaSt. Vincent and the GrenadinesSudanSwedenSwitzerlandSyriaTaiwanThailandTrinidad and TobagoTurkeyUgandaUkraineUruguayUzbekistanVenezuelaVietnamWest IndiesWestern AfricaWestern AsiaWestern EuropeYemenZaireZimbabweAzores
3 or more Vehicles in Household
Income
Poverty
Unemployment
Labor Participation
Family Structure
Vehicle Availability
Education Level
Disability

Northern European 3 or more Vehicles in Household
Exceptional

22.0%
3+ VEHICLES AVAILABLE
99.9/ 100
METRIC RATING
66th/ 347
METRIC RANK

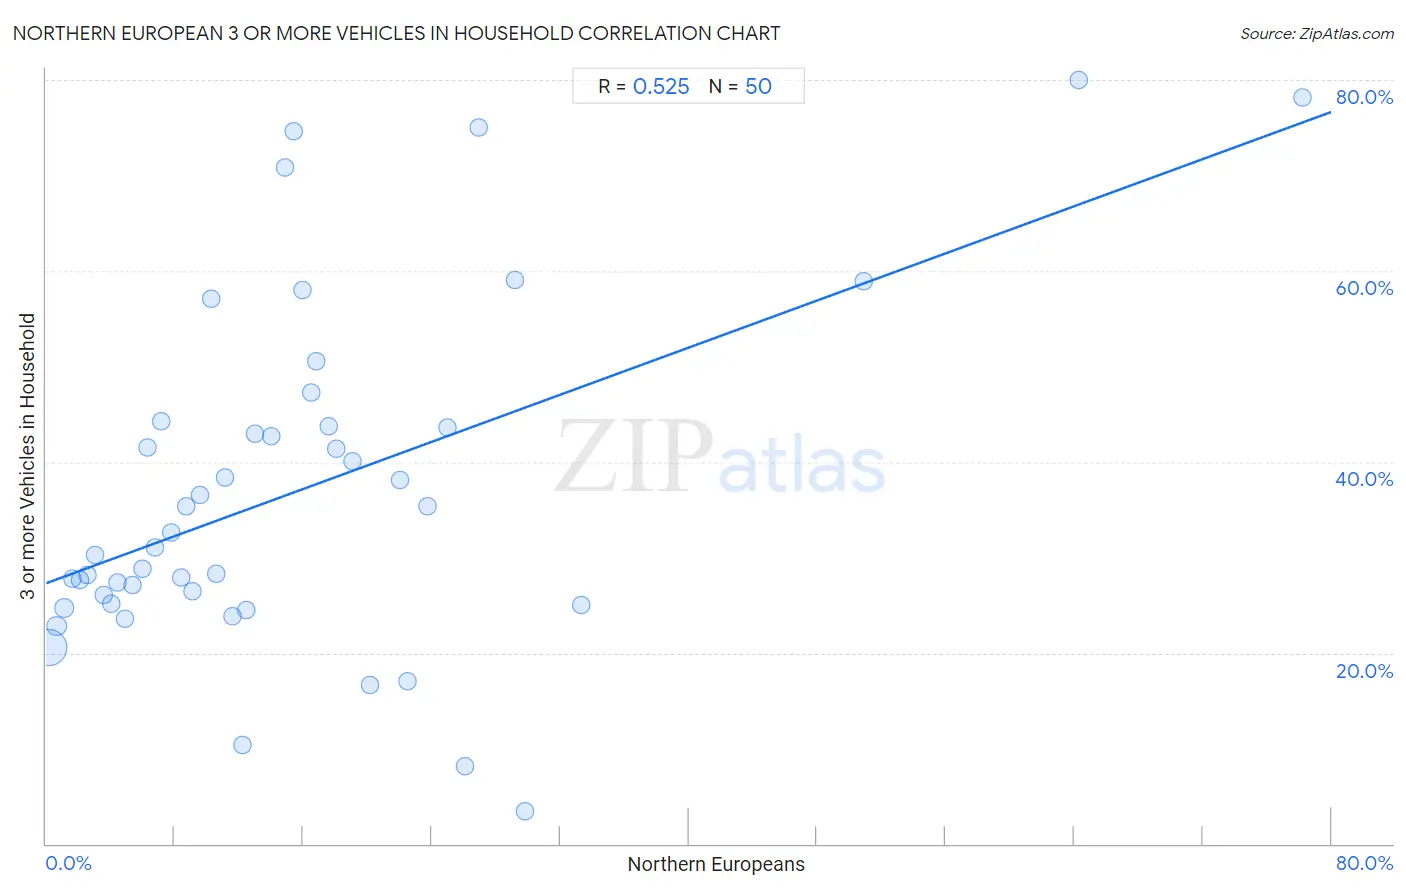
Northern European 3 or more Vehicles in Household Correlation Chart

The statistical analysis conducted on geographies consisting of 405,855,528 people shows a substantial positive correlation between the proportion of Northern Europeans and percentage of households with 3 or more vehicles available in the United States with a correlation coefficient (R) of 0.525 and weighted average of 22.0%. On average, for every 1% (one percent) increase in Northern Europeans within a typical geography, there is an increase of 0.62% in percentage of households with 3 or more vehicles available.
Northern European 3 or more Vehicles in Household
It is essential to understand that the correlation between the percentage of Northern Europeans and percentage of households with 3 or more vehicles available does not imply a direct cause-and-effect relationship. It remains uncertain whether the presence of Northern Europeans influences an upward or downward trend in the level of percentage of households with 3 or more vehicles available within an area, or if Northern Europeans simply ended up residing in those areas with higher or lower levels of percentage of households with 3 or more vehicles available due to other factors.

Demographics Similar to Northern Europeans by 3 or more Vehicles in Household

In terms of 3 or more vehicles in household, the demographic groups most similar to Northern Europeans are Pima (22.0%, a difference of 0.14%), Alaskan Athabascan (21.9%, a difference of 0.26%), British (21.9%, a difference of 0.41%), Creek (21.9%, a difference of 0.43%), and Immigrants from Taiwan (22.1%, a difference of 0.56%).
DemographicsRating | Rank3 or more Vehicles in Household
Navajo
100.0
/100
|
#59
Exceptional
22.3%
Finns
99.9
/100
|
#60
Exceptional
22.3%
Bhutanese
99.9
/100
|
#61
Exceptional
22.2%
Fijians
99.9
/100
|
#62
Exceptional
22.2%
Chickasaw
99.9
/100
|
#63
Exceptional
22.2%
Immigrants from Taiwan
99.9
/100
|
#64
Exceptional
22.1%
Pima
99.9
/100
|
#65
Exceptional
22.0%
Northern Europeans
99.9
/100
|
#66
Exceptional
22.0%
Alaskan Athabascans
99.9
/100
|
#67
Exceptional
21.9%
British
99.9
/100
|
#68
Exceptional
21.9%
Creek
99.9
/100
|
#69
Exceptional
21.9%
Bangladeshis
99.8
/100
|
#70
Exceptional
21.9%
Potawatomi
99.8
/100
|
#71
Exceptional
21.9%
Portuguese
99.8
/100
|
#72
Exceptional
21.8%
Salvadorans
99.8
/100
|
#73
Exceptional
21.8%

Northern European 3 or more Vehicles in Household Correlation Summary

MeasurementNorthern European Data3 or more Vehicles in Household Data
Minimum0.15%3.4%
Maximum78.2%80.0%
Range78.1%76.6%
Mean15.7%37.0%
Median11.9%31.9%
Interquartile 25% (IQ1)6.0%25.2%
Interquartile 75% (IQ3)20.1%43.8%
Interquartile Range (IQR)14.2%18.6%
Standard Deviation (Sample)15.3%18.0%
Standard Deviation (Population)15.1%17.8%

Correlation Details

Northern European PercentileSample Size3 or more Vehicles in Household
[
0.0%
-
0.5%
]
0.15%
366,387,06820.6%
[
0.5%
-
1.0%
]
0.64%
31,266,19122.8%
[
1.0%
-
1.5%
]
1.12%
5,040,69224.7%
[
1.5%
-
2.0%
]
1.60%
1,804,83627.8%
[
2.0%
-
2.5%
]
2.09%
512,88227.7%
[
2.5%
-
3.0%
]
2.55%
275,75528.1%
[
3.0%
-
3.5%
]
3.07%
149,23330.2%
[
3.5%
-
4.0%
]
3.54%
137,62126.1%
[
4.0%
-
4.5%
]
4.07%
100,18025.2%
[
4.0%
-
4.5%
]
4.47%
35,16627.3%
[
4.5%
-
5.0%
]
4.91%
41,99523.6%
[
5.0%
-
5.5%
]
5.37%
35,03627.1%
[
5.5%
-
6.0%
]
5.97%
7,81828.8%
[
6.0%
-
6.5%
]
6.33%
4,40541.6%
[
6.5%
-
7.0%
]
6.79%
9,60031.1%
[
7.0%
-
7.5%
]
7.19%
4,89444.3%
[
7.5%
-
8.0%
]
7.76%
3,26232.7%
[
8.0%
-
8.5%
]
8.39%
4,57827.9%
[
8.5%
-
9.0%
]
8.74%
4,46435.4%
[
9.0%
-
9.5%
]
9.07%
2,81026.5%
[
9.5%
-
10.0%
]
9.61%
2,36236.5%
[
10.0%
-
10.5%
]
10.30%
33057.1%
[
10.5%
-
11.0%
]
10.56%
4,23428.3%
[
11.0%
-
11.5%
]
11.10%
3,15338.4%
[
11.5%
-
12.0%
]
11.60%
3,07723.9%
[
12.0%
-
12.5%
]
12.23%
32710.4%
[
12.0%
-
12.5%
]
12.45%
1,80724.4%
[
12.5%
-
13.0%
]
12.99%
48542.9%
[
13.5%
-
14.0%
]
13.97%
73042.6%
[
14.5%
-
15.0%
]
14.83%
34470.8%
[
15.0%
-
15.5%
]
15.38%
15674.7%
[
15.5%
-
16.0%
]
15.93%
1,06758.1%
[
16.0%
-
16.5%
]
16.50%
1,37047.3%
[
16.5%
-
17.0%
]
16.84%
9550.5%
[
17.5%
-
18.0%
]
17.61%
1,19843.8%
[
18.0%
-
18.5%
]
18.03%
6141.4%
[
19.0%
-
19.5%
]
19.06%
1,03940.1%
[
20.0%
-
20.5%
]
20.14%
42216.7%
[
22.0%
-
22.5%
]
22.03%
45438.1%
[
22.5%
-
23.0%
]
22.51%
1,77717.0%
[
23.5%
-
24.0%
]
23.73%
11835.3%
[
25.0%
-
25.5%
]
25.00%
6843.6%
[
26.0%
-
26.5%
]
26.05%
9068.1%
[
26.5%
-
27.0%
]
26.92%
7875.0%
[
29.0%
-
29.5%
]
29.20%
56559.0%
[
29.5%
-
30.0%
]
29.83%
3523.4%
[
33.0%
-
33.5%
]
33.33%
1225.0%
[
50.5%
-
51.0%
]
50.88%
34059.0%
[
64.0%
-
64.5%
]
64.29%
1480.0%
[
78.0%
-
78.5%
]
78.22%
10178.2%