Northern European Disability Age Under 5
COMPARE
Northern European
Select to Compare
Disability Age Under 5
Northern European Disability Age Under 5
1.6%
DISABILITY | AGE UNDER 5
0.0/ 100
METRIC RATING
291st/ 347
METRIC RANK
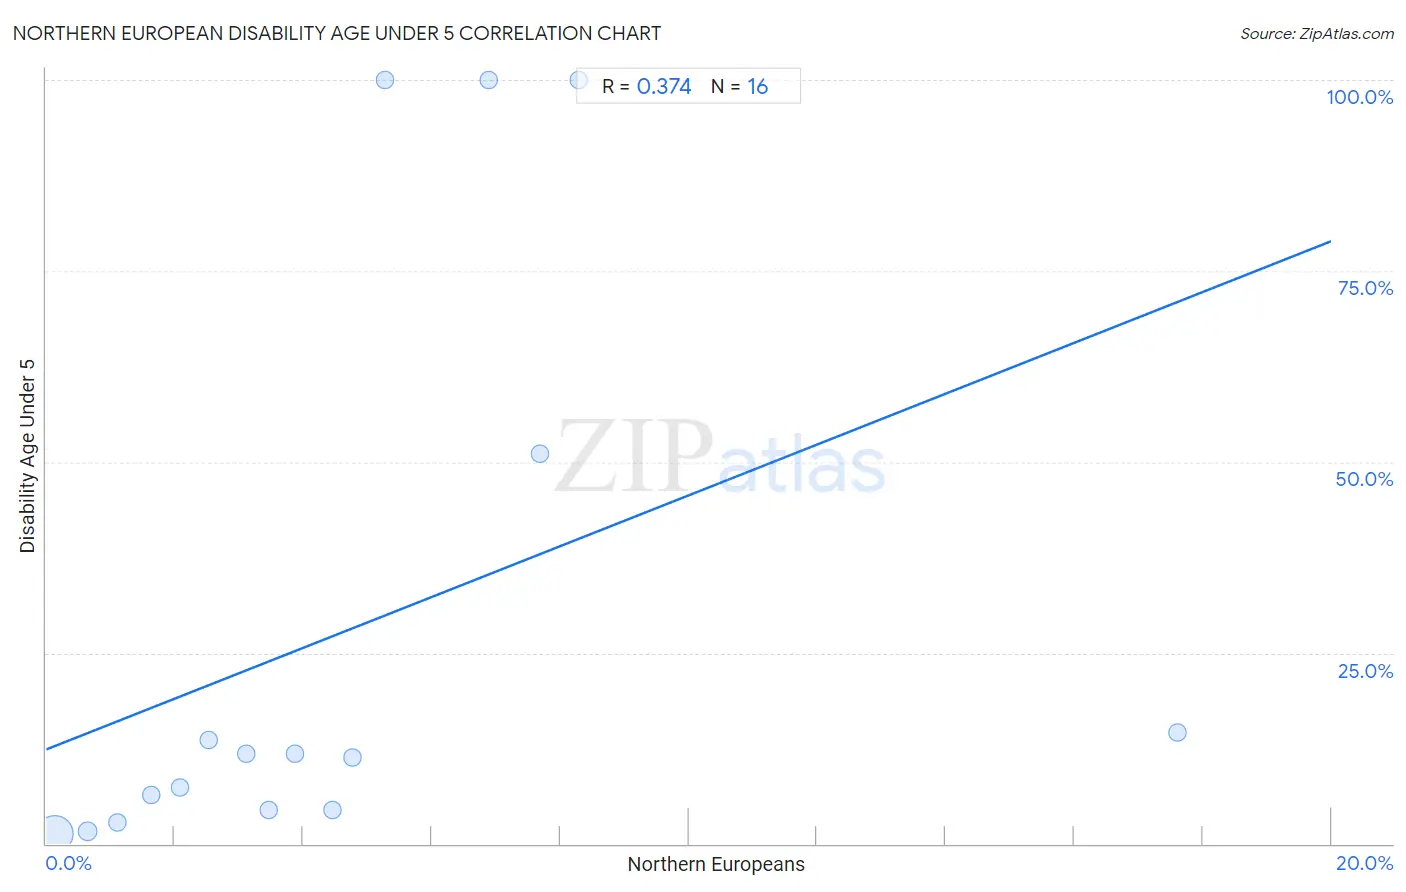
Northern European Disability Age Under 5 Correlation Chart
The statistical analysis conducted on geographies consisting of 214,960,262 people shows a mild positive correlation between the proportion of Northern Europeans and percentage of population with a disability under the age of 5 in the United States with a correlation coefficient (R) of 0.374 and weighted average of 1.6%. On average, for every 1% (one percent) increase in Northern Europeans within a typical geography, there is an increase of 3.3% in percentage of population with a disability under the age of 5.
It is essential to understand that the correlation between the percentage of Northern Europeans and percentage of population with a disability under the age of 5 does not imply a direct cause-and-effect relationship. It remains uncertain whether the presence of Northern Europeans influences an upward or downward trend in the level of percentage of population with a disability under the age of 5 within an area, or if Northern Europeans simply ended up residing in those areas with higher or lower levels of percentage of population with a disability under the age of 5 due to other factors.
Demographics Similar to Northern Europeans by Disability Age Under 5
In terms of disability age under 5, the demographic groups most similar to Northern Europeans are Czech (1.5%, a difference of 0.10%), Italian (1.6%, a difference of 0.14%), Hungarian (1.5%, a difference of 0.22%), Estonian (1.5%, a difference of 0.36%), and Scandinavian (1.5%, a difference of 0.54%).
| Demographics | Rating | Rank | Disability Age Under 5 |
| Europeans | 0.0 /100 | #284 | Tragic 1.5% |
| Croatians | 0.0 /100 | #285 | Tragic 1.5% |
| Tlingit-Haida | 0.0 /100 | #286 | Tragic 1.5% |
| Scandinavians | 0.0 /100 | #287 | Tragic 1.5% |
| Estonians | 0.0 /100 | #288 | Tragic 1.5% |
| Hungarians | 0.0 /100 | #289 | Tragic 1.5% |
| Czechs | 0.0 /100 | #290 | Tragic 1.5% |
| Northern Europeans | 0.0 /100 | #291 | Tragic 1.6% |
| Italians | 0.0 /100 | #292 | Tragic 1.6% |
| Lithuanians | 0.0 /100 | #293 | Tragic 1.6% |
| Swedes | 0.0 /100 | #294 | Tragic 1.6% |
| Finns | 0.0 /100 | #295 | Tragic 1.6% |
| Poles | 0.0 /100 | #296 | Tragic 1.6% |
| Nonimmigrants | 0.0 /100 | #297 | Tragic 1.6% |
| Cajuns | 0.0 /100 | #298 | Tragic 1.6% |
Northern European Disability Age Under 5 Correlation Summary
| Measurement | Northern European Data | Disability Age Under 5 Data |
| Minimum | 0.14% | 1.2% |
| Maximum | 17.6% | 100.0% |
| Range | 17.5% | 98.8% |
| Mean | 4.6% | 27.6% |
| Median | 3.7% | 11.5% |
| Interquartile 25% (IQ1) | 1.9% | 4.4% |
| Interquartile 75% (IQ3) | 6.1% | 32.8% |
| Interquartile Range (IQR) | 4.2% | 28.4% |
| Standard Deviation (Sample) | 4.2% | 37.7% |
| Standard Deviation (Population) | 4.1% | 36.5% |
Correlation Details
| Northern European Percentile | Sample Size | Disability Age Under 5 |
[ 0.0% - 0.5% ] 0.14% | 201,222,638 | 1.2% |
[ 0.5% - 1.0% ] 0.64% | 11,796,940 | 1.6% |
[ 1.0% - 1.5% ] 1.10% | 1,526,283 | 2.8% |
[ 1.5% - 2.0% ] 1.64% | 221,680 | 6.4% |
[ 2.0% - 2.5% ] 2.08% | 146,878 | 7.4% |
[ 2.5% - 3.0% ] 2.53% | 26,939 | 13.6% |
[ 3.0% - 3.5% ] 3.11% | 483 | 11.8% |
[ 3.0% - 3.5% ] 3.47% | 6,542 | 4.4% |
[ 3.5% - 4.0% ] 3.88% | 1,702 | 11.8% |
[ 4.0% - 4.5% ] 4.46% | 4,689 | 4.4% |
[ 4.5% - 5.0% ] 4.76% | 1,763 | 11.3% |
[ 5.0% - 5.5% ] 5.27% | 911 | 100.0% |
[ 6.5% - 7.0% ] 6.90% | 232 | 100.0% |
[ 7.5% - 8.0% ] 7.69% | 1,275 | 51.1% |
[ 8.0% - 8.5% ] 8.28% | 495 | 100.0% |
[ 17.5% - 18.0% ] 17.61% | 812 | 14.6% |