Northern European College, Under 1 year
COMPARE
Northern European
Select to Compare
College, Under 1 year
Northern European College, Under 1 year
69.0%
COLLEGE, UNDER 1 YEAR
99.4/ 100
METRIC RATING
64th/ 347
METRIC RANK
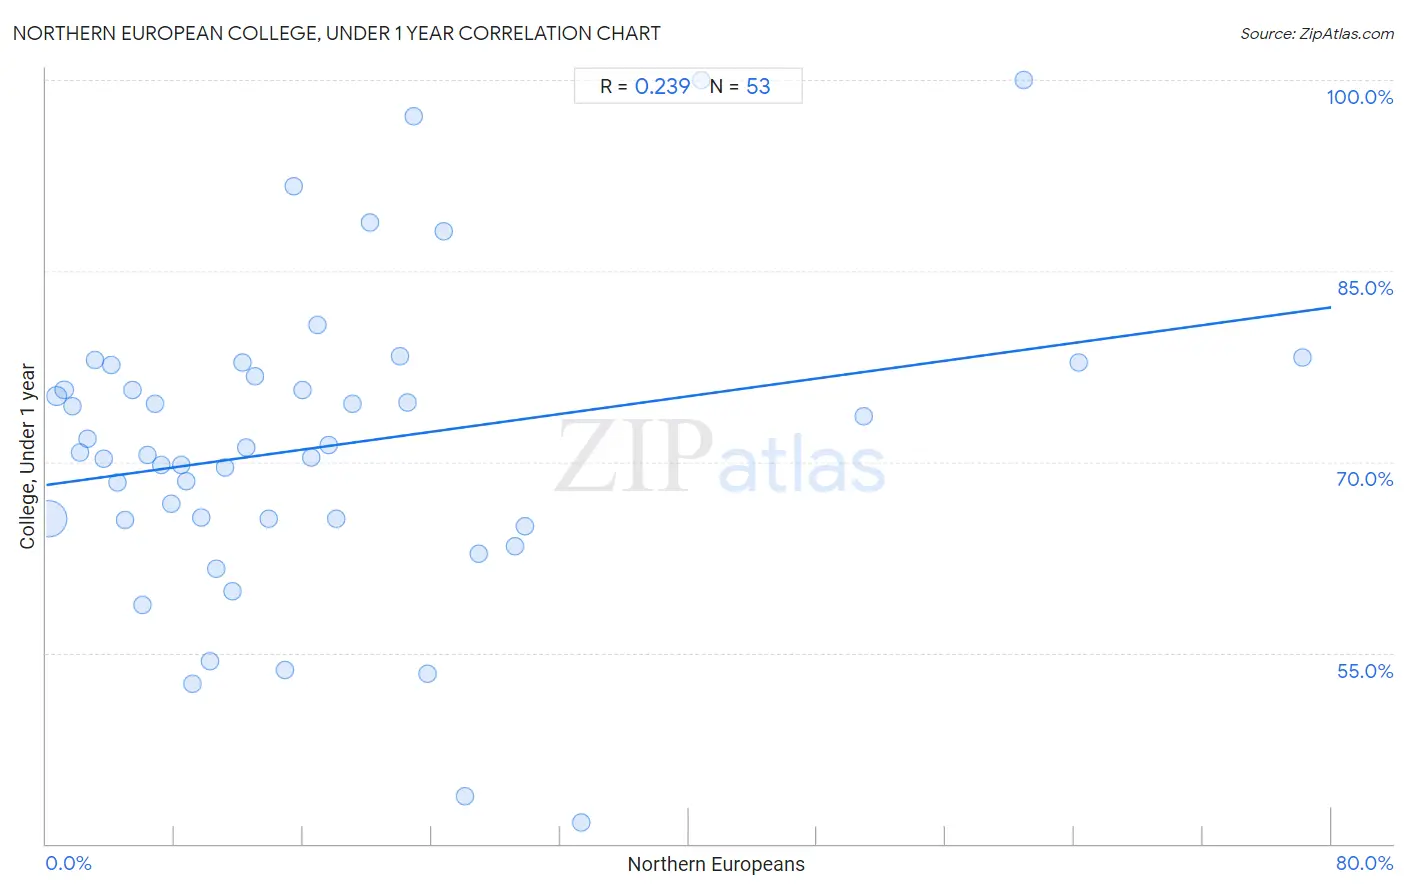
Northern European College, Under 1 year Correlation Chart
The statistical analysis conducted on geographies consisting of 406,096,233 people shows a weak positive correlation between the proportion of Northern Europeans and percentage of population with at least college, under 1 year education in the United States with a correlation coefficient (R) of 0.239 and weighted average of 69.0%. On average, for every 1% (one percent) increase in Northern Europeans within a typical geography, there is an increase of 0.17% in percentage of population with at least college, under 1 year education.
It is essential to understand that the correlation between the percentage of Northern Europeans and percentage of population with at least college, under 1 year education does not imply a direct cause-and-effect relationship. It remains uncertain whether the presence of Northern Europeans influences an upward or downward trend in the level of percentage of population with at least college, under 1 year education within an area, or if Northern Europeans simply ended up residing in those areas with higher or lower levels of percentage of population with at least college, under 1 year education due to other factors.
Demographics Similar to Northern Europeans by College, Under 1 year
In terms of college, under 1 year, the demographic groups most similar to Northern Europeans are Immigrants from Moldova (69.0%, a difference of 0.020%), Immigrants from Canada (69.1%, a difference of 0.040%), Immigrants from North America (69.0%, a difference of 0.040%), Immigrants from Kazakhstan (69.2%, a difference of 0.17%), and Immigrants from Belarus (69.2%, a difference of 0.17%).
| Demographics | Rating | Rank | College, Under 1 year |
| Asians | 99.6 /100 | #57 | Exceptional 69.4% |
| Immigrants from Malaysia | 99.6 /100 | #58 | Exceptional 69.3% |
| Immigrants from Serbia | 99.5 /100 | #59 | Exceptional 69.3% |
| Immigrants from Asia | 99.5 /100 | #60 | Exceptional 69.2% |
| Immigrants from Kazakhstan | 99.5 /100 | #61 | Exceptional 69.2% |
| Immigrants from Belarus | 99.5 /100 | #62 | Exceptional 69.2% |
| Immigrants from Canada | 99.4 /100 | #63 | Exceptional 69.1% |
| Northern Europeans | 99.4 /100 | #64 | Exceptional 69.0% |
| Immigrants from Moldova | 99.3 /100 | #65 | Exceptional 69.0% |
| Immigrants from North America | 99.3 /100 | #66 | Exceptional 69.0% |
| Immigrants from Zimbabwe | 99.2 /100 | #67 | Exceptional 68.9% |
| Immigrants from Indonesia | 99.2 /100 | #68 | Exceptional 68.9% |
| Immigrants from Romania | 99.2 /100 | #69 | Exceptional 68.9% |
| Lithuanians | 99.1 /100 | #70 | Exceptional 68.8% |
| Immigrants from Europe | 99.1 /100 | #71 | Exceptional 68.8% |
Northern European College, Under 1 year Correlation Summary
| Measurement | Northern European Data | College, Under 1 year Data |
| Minimum | 0.15% | 41.7% |
| Maximum | 78.2% | 100.0% |
| Range | 78.1% | 58.3% |
| Mean | 17.2% | 71.2% |
| Median | 12.5% | 70.7% |
| Interquartile 25% (IQ1) | 6.1% | 65.5% |
| Interquartile 75% (IQ3) | 22.7% | 77.2% |
| Interquartile Range (IQR) | 16.6% | 11.7% |
| Standard Deviation (Sample) | 16.4% | 12.0% |
| Standard Deviation (Population) | 16.3% | 11.9% |
Correlation Details
| Northern European Percentile | Sample Size | College, Under 1 year |
[ 0.0% - 0.5% ] 0.15% | 366,554,366 | 65.5% |
[ 0.5% - 1.0% ] 0.64% | 31,318,074 | 75.2% |
[ 1.0% - 1.5% ] 1.12% | 5,045,713 | 75.7% |
[ 1.5% - 2.0% ] 1.60% | 1,812,941 | 74.3% |
[ 2.0% - 2.5% ] 2.09% | 514,069 | 70.7% |
[ 2.5% - 3.0% ] 2.55% | 275,913 | 71.8% |
[ 3.0% - 3.5% ] 3.07% | 150,643 | 78.0% |
[ 3.5% - 4.0% ] 3.54% | 137,621 | 70.2% |
[ 4.0% - 4.5% ] 4.07% | 100,180 | 77.6% |
[ 4.0% - 4.5% ] 4.47% | 35,166 | 68.4% |
[ 4.5% - 5.0% ] 4.91% | 42,516 | 65.4% |
[ 5.0% - 5.5% ] 5.37% | 35,982 | 75.7% |
[ 5.5% - 6.0% ] 5.96% | 8,232 | 58.8% |
[ 6.0% - 6.5% ] 6.33% | 4,405 | 70.6% |
[ 6.5% - 7.0% ] 6.79% | 9,600 | 74.5% |
[ 7.0% - 7.5% ] 7.19% | 4,894 | 69.8% |
[ 7.5% - 8.0% ] 7.76% | 3,262 | 66.7% |
[ 8.0% - 8.5% ] 8.38% | 5,073 | 69.7% |
[ 8.5% - 9.0% ] 8.74% | 4,464 | 68.5% |
[ 9.0% - 9.5% ] 9.08% | 3,027 | 52.6% |
[ 9.5% - 10.0% ] 9.62% | 2,548 | 65.6% |
[ 10.0% - 10.5% ] 10.22% | 2,045 | 54.3% |
[ 10.5% - 11.0% ] 10.56% | 4,234 | 61.6% |
[ 11.0% - 11.5% ] 11.10% | 3,207 | 69.6% |
[ 11.5% - 12.0% ] 11.60% | 3,077 | 59.9% |
[ 12.0% - 12.5% ] 12.23% | 327 | 77.8% |
[ 12.0% - 12.5% ] 12.45% | 1,807 | 71.2% |
[ 12.5% - 13.0% ] 12.99% | 485 | 76.7% |
[ 13.5% - 14.0% ] 13.88% | 1,189 | 65.5% |
[ 14.5% - 15.0% ] 14.83% | 445 | 53.7% |
[ 15.0% - 15.5% ] 15.38% | 156 | 91.7% |
[ 15.5% - 16.0% ] 15.93% | 1,067 | 75.7% |
[ 16.0% - 16.5% ] 16.50% | 1,370 | 70.4% |
[ 16.5% - 17.0% ] 16.85% | 178 | 80.7% |
[ 17.5% - 18.0% ] 17.61% | 1,198 | 71.3% |
[ 18.0% - 18.5% ] 18.03% | 61 | 65.6% |
[ 19.0% - 19.5% ] 19.06% | 1,039 | 74.6% |
[ 20.0% - 20.5% ] 20.14% | 422 | 88.8% |
[ 22.0% - 22.5% ] 22.03% | 454 | 78.3% |
[ 22.5% - 23.0% ] 22.51% | 1,777 | 74.6% |
[ 22.5% - 23.0% ] 22.89% | 249 | 97.1% |
[ 23.5% - 24.0% ] 23.73% | 118 | 53.4% |
[ 24.5% - 25.0% ] 24.74% | 194 | 88.1% |
[ 26.0% - 26.5% ] 26.05% | 906 | 43.7% |
[ 26.5% - 27.0% ] 26.92% | 78 | 62.8% |
[ 29.0% - 29.5% ] 29.20% | 565 | 63.4% |
[ 29.5% - 30.0% ] 29.83% | 352 | 65.0% |
[ 33.0% - 33.5% ] 33.33% | 12 | 41.7% |
[ 40.5% - 41.0% ] 40.74% | 54 | 100.0% |
[ 50.5% - 51.0% ] 50.88% | 340 | 73.6% |
[ 60.5% - 61.0% ] 60.87% | 23 | 100.0% |
[ 64.0% - 64.5% ] 64.29% | 14 | 77.8% |
[ 78.0% - 78.5% ] 78.22% | 101 | 78.2% |