Northern European Receiving Food Stamps
COMPARE
Northern European
Select to Compare
Receiving Food Stamps
Northern European Receiving Food Stamps
9.8%
PUBLIC INCOME | FOOD STAMPS
99.0/ 100
METRIC RATING
68th/ 347
METRIC RANK
Northern European Receiving Food Stamps Correlation Chart
The statistical analysis conducted on geographies consisting of 404,897,441 people shows a moderate positive correlation between the proportion of Northern Europeans and percentage of population receiving government assistance and/or food stamps in the United States with a correlation coefficient (R) of 0.400 and weighted average of 9.8%. On average, for every 1% (one percent) increase in Northern Europeans within a typical geography, there is an increase of 0.27% in percentage of population receiving government assistance and/or food stamps.
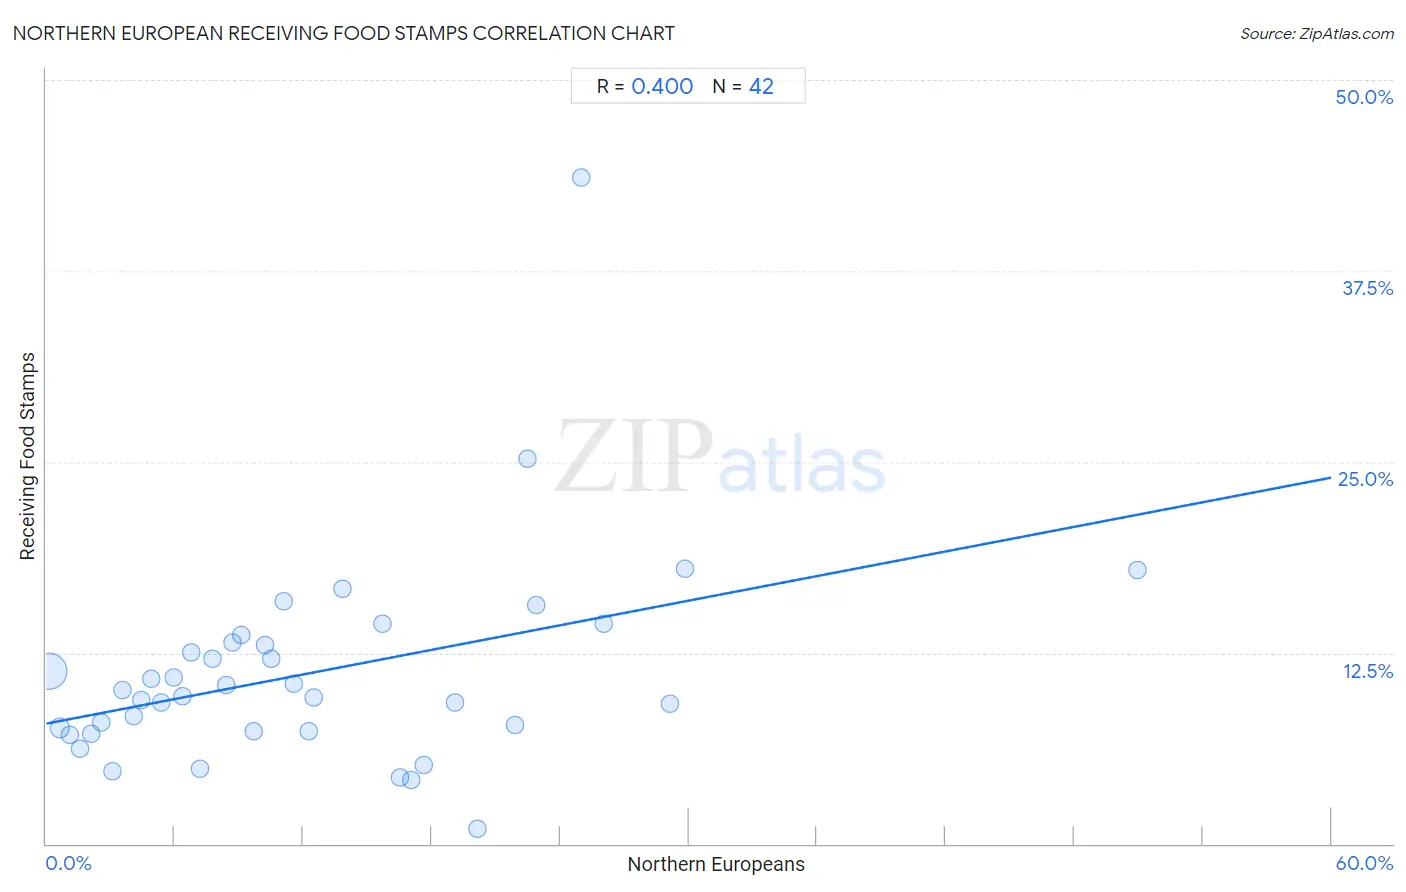
It is essential to understand that the correlation between the percentage of Northern Europeans and percentage of population receiving government assistance and/or food stamps does not imply a direct cause-and-effect relationship. It remains uncertain whether the presence of Northern Europeans influences an upward or downward trend in the level of percentage of population receiving government assistance and/or food stamps within an area, or if Northern Europeans simply ended up residing in those areas with higher or lower levels of percentage of population receiving government assistance and/or food stamps due to other factors.
Demographics Similar to Northern Europeans by Receiving Food Stamps
In terms of receiving food stamps, the demographic groups most similar to Northern Europeans are Immigrants from Indonesia (9.8%, a difference of 0.060%), Italian (9.9%, a difference of 0.21%), Slovene (9.8%, a difference of 0.22%), Immigrants from Serbia (9.9%, a difference of 0.26%), and Scottish (9.9%, a difference of 0.39%).
| Demographics | Rating | Rank | Receiving Food Stamps |
| English | 99.2 /100 | #61 | Exceptional 9.8% |
| Immigrants from Bulgaria | 99.2 /100 | #62 | Exceptional 9.8% |
| Chinese | 99.2 /100 | #63 | Exceptional 9.8% |
| Immigrants from North America | 99.2 /100 | #64 | Exceptional 9.8% |
| Immigrants from Turkey | 99.1 /100 | #65 | Exceptional 9.8% |
| Slovenes | 99.1 /100 | #66 | Exceptional 9.8% |
| Immigrants from Indonesia | 99.0 /100 | #67 | Exceptional 9.8% |
| Northern Europeans | 99.0 /100 | #68 | Exceptional 9.8% |
| Italians | 99.0 /100 | #69 | Exceptional 9.9% |
| Immigrants from Serbia | 99.0 /100 | #70 | Exceptional 9.9% |
| Scottish | 98.9 /100 | #71 | Exceptional 9.9% |
| Immigrants from Asia | 98.9 /100 | #72 | Exceptional 9.9% |
| Macedonians | 98.9 /100 | #73 | Exceptional 9.9% |
| New Zealanders | 98.8 /100 | #74 | Exceptional 9.9% |
| Immigrants from Zimbabwe | 98.7 /100 | #75 | Exceptional 9.9% |
Northern European Receiving Food Stamps Correlation Summary
| Measurement | Northern European Data | Receiving Food Stamps Data |
| Minimum | 0.15% | 1.0% |
| Maximum | 51.0% | 43.6% |
| Range | 50.8% | 42.6% |
| Mean | 12.4% | 11.2% |
| Median | 10.0% | 9.9% |
| Interquartile 25% (IQ1) | 4.9% | 7.4% |
| Interquartile 75% (IQ3) | 17.6% | 13.2% |
| Interquartile Range (IQR) | 12.7% | 5.8% |
| Standard Deviation (Sample) | 10.2% | 6.8% |
| Standard Deviation (Population) | 10.1% | 6.8% |
Correlation Details
| Northern European Percentile | Sample Size | Receiving Food Stamps |
[ 0.0% - 0.5% ] 0.15% | 365,880,030 | 11.3% |
[ 0.5% - 1.0% ] 0.64% | 31,042,070 | 7.6% |
[ 1.0% - 1.5% ] 1.12% | 4,941,380 | 7.1% |
[ 1.5% - 2.0% ] 1.60% | 1,754,500 | 6.2% |
[ 2.0% - 2.5% ] 2.09% | 492,520 | 7.2% |
[ 2.5% - 3.0% ] 2.54% | 258,475 | 8.0% |
[ 3.0% - 3.5% ] 3.08% | 145,295 | 4.8% |
[ 3.5% - 4.0% ] 3.54% | 129,575 | 10.1% |
[ 4.0% - 4.5% ] 4.09% | 94,632 | 8.4% |
[ 4.0% - 4.5% ] 4.46% | 30,186 | 9.4% |
[ 4.5% - 5.0% ] 4.90% | 39,935 | 10.8% |
[ 5.0% - 5.5% ] 5.37% | 35,494 | 9.3% |
[ 5.5% - 6.0% ] 5.96% | 7,227 | 10.9% |
[ 6.0% - 6.5% ] 6.33% | 4,405 | 9.6% |
[ 6.5% - 7.0% ] 6.78% | 3,833 | 12.5% |
[ 7.0% - 7.5% ] 7.16% | 4,536 | 4.9% |
[ 7.5% - 8.0% ] 7.77% | 2,560 | 12.1% |
[ 8.0% - 8.5% ] 8.39% | 4,257 | 10.4% |
[ 8.5% - 9.0% ] 8.68% | 2,395 | 13.2% |
[ 9.0% - 9.5% ] 9.08% | 2,897 | 13.7% |
[ 9.5% - 10.0% ] 9.66% | 1,687 | 7.4% |
[ 10.0% - 10.5% ] 10.24% | 1,719 | 13.0% |
[ 10.5% - 11.0% ] 10.53% | 2,744 | 12.1% |
[ 11.0% - 11.5% ] 11.10% | 3,127 | 15.9% |
[ 11.5% - 12.0% ] 11.57% | 2,455 | 10.5% |
[ 12.0% - 12.5% ] 12.23% | 327 | 7.4% |
[ 12.0% - 12.5% ] 12.49% | 961 | 9.6% |
[ 13.5% - 14.0% ] 13.80% | 594 | 16.7% |
[ 15.5% - 16.0% ] 15.67% | 268 | 14.4% |
[ 16.5% - 17.0% ] 16.53% | 1,204 | 4.3% |
[ 17.0% - 17.5% ] 17.02% | 47 | 4.2% |
[ 17.5% - 18.0% ] 17.61% | 1,198 | 5.1% |
[ 19.0% - 19.5% ] 19.07% | 813 | 9.2% |
[ 20.0% - 20.5% ] 20.14% | 422 | 1.0% |
[ 21.5% - 22.0% ] 21.89% | 233 | 7.8% |
[ 22.0% - 22.5% ] 22.47% | 1,286 | 25.2% |
[ 22.5% - 23.0% ] 22.89% | 249 | 15.6% |
[ 25.0% - 25.5% ] 25.00% | 68 | 43.6% |
[ 26.0% - 26.5% ] 26.05% | 906 | 14.4% |
[ 29.0% - 29.5% ] 29.11% | 316 | 9.2% |
[ 29.5% - 30.0% ] 29.83% | 352 | 18.0% |
[ 50.5% - 51.0% ] 50.95% | 263 | 17.9% |