Immigrants from Spain GED/Equivalency
COMPARE
Immigrants from Spain
Select to Compare
GED/Equivalency
Immigrants from Spain GED/Equivalency
86.7%
GED/EQUIVALENCY
88.5/ 100
METRIC RATING
131st/ 347
METRIC RANK
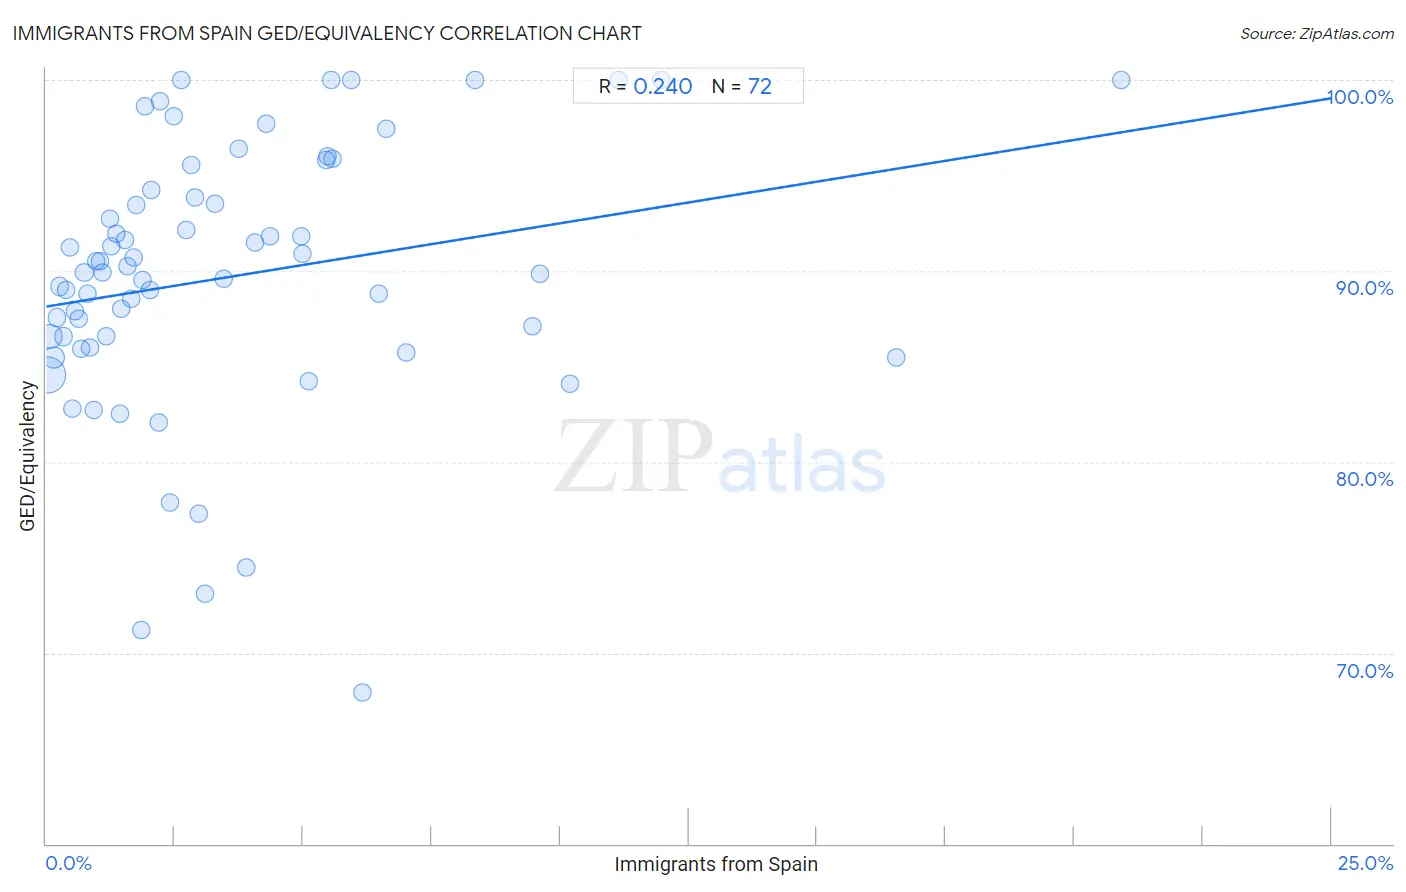
Immigrants from Spain GED/Equivalency Correlation Chart
The statistical analysis conducted on geographies consisting of 239,682,725 people shows a weak positive correlation between the proportion of Immigrants from Spain and percentage of population with at least ged/equivalency education in the United States with a correlation coefficient (R) of 0.240 and weighted average of 86.7%. On average, for every 1% (one percent) increase in Immigrants from Spain within a typical geography, there is an increase of 0.44% in percentage of population with at least ged/equivalency education.
It is essential to understand that the correlation between the percentage of Immigrants from Spain and percentage of population with at least ged/equivalency education does not imply a direct cause-and-effect relationship. It remains uncertain whether the presence of Immigrants from Spain influences an upward or downward trend in the level of percentage of population with at least ged/equivalency education within an area, or if Immigrants from Spain simply ended up residing in those areas with higher or lower levels of percentage of population with at least ged/equivalency education due to other factors.
Demographics Similar to Immigrants from Spain by GED/Equivalency
In terms of ged/equivalency, the demographic groups most similar to Immigrants from Spain are Immigrants from Brazil (86.6%, a difference of 0.0%), Tsimshian (86.6%, a difference of 0.010%), Immigrants from Ukraine (86.7%, a difference of 0.020%), Immigrants from Germany (86.7%, a difference of 0.020%), and Albanian (86.6%, a difference of 0.040%).
| Demographics | Rating | Rank | GED/Equivalency |
| Immigrants from Egypt | 90.4 /100 | #124 | Exceptional 86.7% |
| Celtics | 90.4 /100 | #125 | Exceptional 86.7% |
| Asians | 90.3 /100 | #126 | Exceptional 86.7% |
| Argentineans | 89.7 /100 | #127 | Excellent 86.7% |
| Yugoslavians | 89.5 /100 | #128 | Excellent 86.7% |
| Immigrants from Ukraine | 88.9 /100 | #129 | Excellent 86.7% |
| Immigrants from Germany | 88.8 /100 | #130 | Excellent 86.7% |
| Immigrants from Spain | 88.5 /100 | #131 | Excellent 86.7% |
| Immigrants from Brazil | 88.4 /100 | #132 | Excellent 86.6% |
| Tsimshian | 88.3 /100 | #133 | Excellent 86.6% |
| Albanians | 87.7 /100 | #134 | Excellent 86.6% |
| Immigrants from Asia | 87.4 /100 | #135 | Excellent 86.6% |
| Chileans | 86.9 /100 | #136 | Excellent 86.6% |
| Arabs | 86.7 /100 | #137 | Excellent 86.6% |
| Immigrants from Argentina | 86.5 /100 | #138 | Excellent 86.6% |
Immigrants from Spain GED/Equivalency Correlation Summary
| Measurement | Immigrants from Spain Data | GED/Equivalency Data |
| Minimum | 0.029% | 67.9% |
| Maximum | 20.9% | 100.0% |
| Range | 20.9% | 32.1% |
| Mean | 3.6% | 89.7% |
| Median | 2.2% | 89.9% |
| Interquartile 25% (IQ1) | 1.1% | 86.3% |
| Interquartile 75% (IQ3) | 5.0% | 94.1% |
| Interquartile Range (IQR) | 4.0% | 7.8% |
| Standard Deviation (Sample) | 3.8% | 7.0% |
| Standard Deviation (Population) | 3.8% | 6.9% |
Correlation Details
| Immigrants from Spain Percentile | Sample Size | GED/Equivalency |
[ 0.0% - 0.5% ] 0.029% | 140,388,875 | 84.6% |
[ 0.0% - 0.5% ] 0.085% | 43,924,215 | 86.6% |
[ 0.0% - 0.5% ] 0.14% | 27,698,673 | 85.5% |
[ 0.0% - 0.5% ] 0.21% | 8,674,942 | 87.5% |
[ 0.0% - 0.5% ] 0.26% | 5,934,912 | 89.2% |
[ 0.0% - 0.5% ] 0.33% | 3,601,666 | 86.6% |
[ 0.0% - 0.5% ] 0.39% | 2,041,442 | 89.0% |
[ 0.0% - 0.5% ] 0.45% | 1,431,260 | 91.2% |
[ 0.5% - 1.0% ] 0.51% | 1,891,367 | 82.8% |
[ 0.5% - 1.0% ] 0.57% | 890,404 | 87.9% |
[ 0.5% - 1.0% ] 0.63% | 691,250 | 87.5% |
[ 0.5% - 1.0% ] 0.69% | 344,079 | 85.9% |
[ 0.5% - 1.0% ] 0.74% | 185,471 | 89.9% |
[ 0.5% - 1.0% ] 0.81% | 293,741 | 88.8% |
[ 0.5% - 1.0% ] 0.86% | 214,031 | 86.0% |
[ 0.5% - 1.0% ] 0.93% | 169,833 | 82.7% |
[ 0.5% - 1.0% ] 0.98% | 160,565 | 90.5% |
[ 1.0% - 1.5% ] 1.05% | 175,975 | 90.5% |
[ 1.0% - 1.5% ] 1.10% | 177,669 | 89.9% |
[ 1.0% - 1.5% ] 1.16% | 81,660 | 86.6% |
[ 1.0% - 1.5% ] 1.23% | 68,154 | 92.7% |
[ 1.0% - 1.5% ] 1.27% | 39,392 | 91.3% |
[ 1.0% - 1.5% ] 1.35% | 99,638 | 92.0% |
[ 1.0% - 1.5% ] 1.44% | 627 | 82.5% |
[ 1.0% - 1.5% ] 1.46% | 98,051 | 88.0% |
[ 1.5% - 2.0% ] 1.53% | 25,385 | 91.6% |
[ 1.5% - 2.0% ] 1.58% | 6,512 | 90.2% |
[ 1.5% - 2.0% ] 1.66% | 3,133 | 88.5% |
[ 1.5% - 2.0% ] 1.69% | 7,493 | 90.7% |
[ 1.5% - 2.0% ] 1.74% | 10,260 | 93.5% |
[ 1.5% - 2.0% ] 1.84% | 60,728 | 71.2% |
[ 1.5% - 2.0% ] 1.87% | 9,495 | 89.5% |
[ 1.5% - 2.0% ] 1.92% | 468 | 98.6% |
[ 2.0% - 2.5% ] 2.01% | 53,976 | 89.0% |
[ 2.0% - 2.5% ] 2.04% | 5,881 | 94.2% |
[ 2.0% - 2.5% ] 2.20% | 90,500 | 82.1% |
[ 2.0% - 2.5% ] 2.22% | 270 | 98.9% |
[ 2.0% - 2.5% ] 2.42% | 2,069 | 77.9% |
[ 2.0% - 2.5% ] 2.48% | 1,575 | 98.1% |
[ 2.5% - 3.0% ] 2.62% | 191 | 100.0% |
[ 2.5% - 3.0% ] 2.72% | 7,795 | 92.2% |
[ 2.5% - 3.0% ] 2.83% | 14,441 | 95.5% |
[ 2.5% - 3.0% ] 2.90% | 19,922 | 93.9% |
[ 2.5% - 3.0% ] 2.96% | 2,801 | 77.3% |
[ 3.0% - 3.5% ] 3.09% | 194 | 73.1% |
[ 3.0% - 3.5% ] 3.27% | 3,698 | 93.5% |
[ 3.0% - 3.5% ] 3.45% | 1,014 | 89.6% |
[ 3.5% - 4.0% ] 3.75% | 23,340 | 96.4% |
[ 3.5% - 4.0% ] 3.89% | 565 | 74.4% |
[ 4.0% - 4.5% ] 4.05% | 5,500 | 91.5% |
[ 4.0% - 4.5% ] 4.29% | 2,308 | 97.7% |
[ 4.0% - 4.5% ] 4.34% | 4,098 | 91.8% |
[ 4.5% - 5.0% ] 4.95% | 1,475 | 91.8% |
[ 4.5% - 5.0% ] 4.99% | 1,123 | 90.9% |
[ 5.0% - 5.5% ] 5.10% | 824 | 84.2% |
[ 5.0% - 5.5% ] 5.44% | 14,639 | 95.8% |
[ 5.0% - 5.5% ] 5.46% | 14,572 | 96.0% |
[ 5.5% - 6.0% ] 5.56% | 54 | 100.0% |
[ 5.5% - 6.0% ] 5.57% | 2,368 | 95.9% |
[ 5.5% - 6.0% ] 5.94% | 707 | 100.0% |
[ 6.0% - 6.5% ] 6.16% | 146 | 67.9% |
[ 6.0% - 6.5% ] 6.48% | 633 | 88.8% |
[ 6.5% - 7.0% ] 6.61% | 681 | 97.5% |
[ 7.0% - 7.5% ] 7.00% | 714 | 85.7% |
[ 8.0% - 8.5% ] 8.33% | 84 | 100.0% |
[ 9.0% - 9.5% ] 9.47% | 697 | 87.1% |
[ 9.5% - 10.0% ] 9.61% | 281 | 89.8% |
[ 10.0% - 10.5% ] 10.19% | 932 | 84.1% |
[ 11.0% - 11.5% ] 11.14% | 368 | 100.0% |
[ 11.5% - 12.0% ] 11.96% | 418 | 100.0% |
[ 16.5% - 17.0% ] 16.54% | 266 | 85.4% |
[ 20.5% - 21.0% ] 20.92% | 239 | 100.0% |