Immigrants from Spain Wage/Income Gap
COMPARE
Immigrants from Spain
Select to Compare
Wage/Income Gap
Immigrants from Spain Wage/Income Gap
26.8%
WAGE/INCOME GAP
8.5/ 100
METRIC RATING
221st/ 347
METRIC RANK
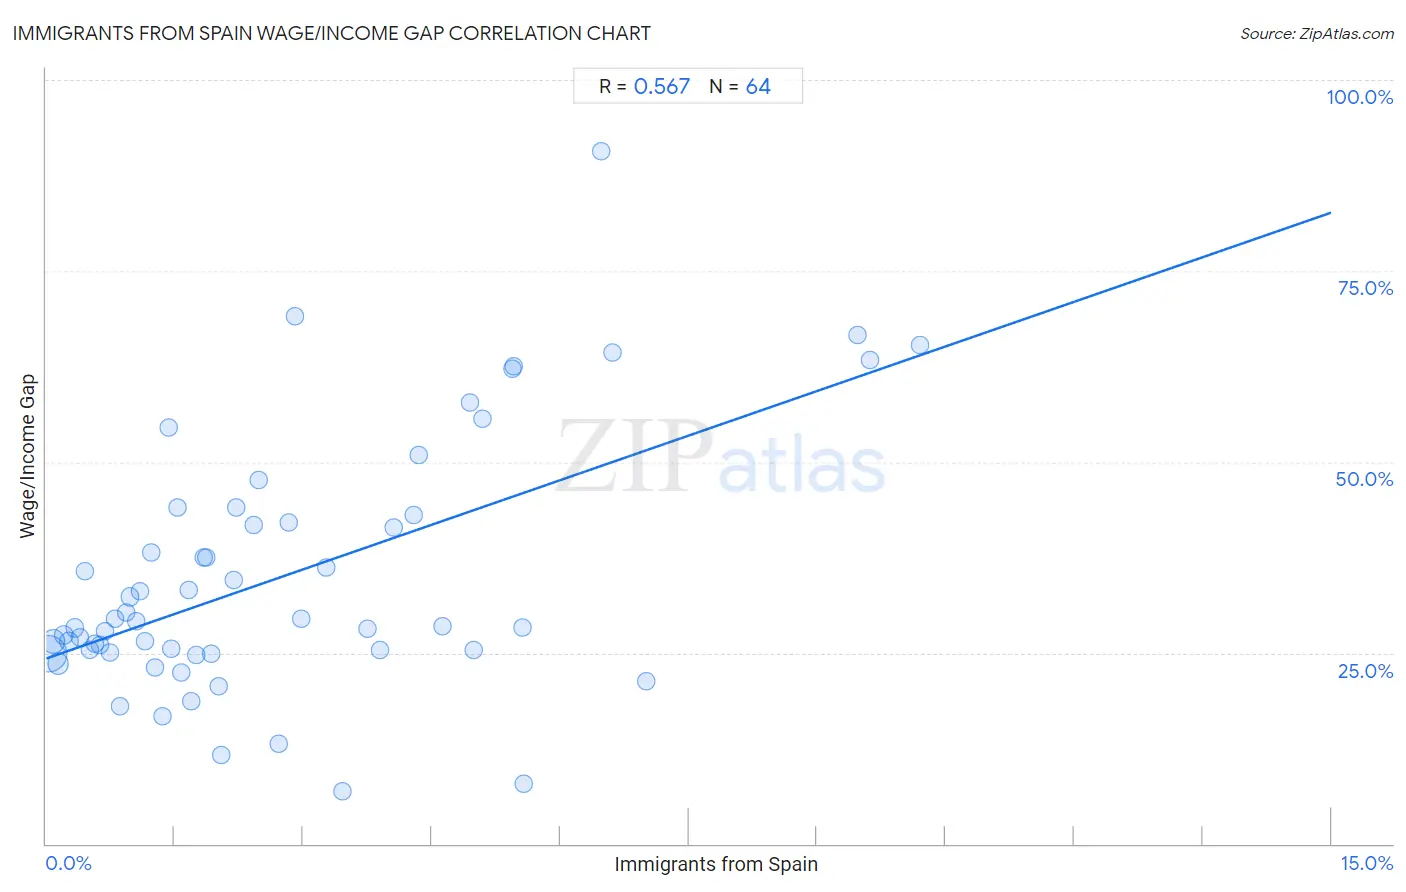
Immigrants from Spain Wage/Income Gap Correlation Chart
The statistical analysis conducted on geographies consisting of 239,614,609 people shows a substantial positive correlation between the proportion of Immigrants from Spain and wage/income gap percentage in the United States with a correlation coefficient (R) of 0.567 and weighted average of 26.8%. On average, for every 1% (one percent) increase in Immigrants from Spain within a typical geography, there is an increase of 3.9% in wage/income gap percentage.
It is essential to understand that the correlation between the percentage of Immigrants from Spain and wage/income gap percentage does not imply a direct cause-and-effect relationship. It remains uncertain whether the presence of Immigrants from Spain influences an upward or downward trend in the level of wage/income gap percentage within an area, or if Immigrants from Spain simply ended up residing in those areas with higher or lower levels of wage/income gap percentage due to other factors.
Demographics Similar to Immigrants from Spain by Wage/Income Gap
In terms of wage/income gap, the demographic groups most similar to Immigrants from Spain are Bolivian (26.8%, a difference of 0.040%), Immigrants from Latvia (26.7%, a difference of 0.070%), Immigrants from Poland (26.7%, a difference of 0.080%), Immigrants from Saudi Arabia (26.7%, a difference of 0.11%), and Jordanian (26.8%, a difference of 0.11%).
| Demographics | Rating | Rank | Wage/Income Gap |
| Immigrants from China | 10.3 /100 | #214 | Poor 26.7% |
| Yugoslavians | 9.7 /100 | #215 | Tragic 26.7% |
| Immigrants from Portugal | 9.5 /100 | #216 | Tragic 26.7% |
| Brazilians | 9.2 /100 | #217 | Tragic 26.7% |
| Immigrants from Saudi Arabia | 9.1 /100 | #218 | Tragic 26.7% |
| Immigrants from Poland | 8.9 /100 | #219 | Tragic 26.7% |
| Immigrants from Latvia | 8.9 /100 | #220 | Tragic 26.7% |
| Immigrants from Spain | 8.5 /100 | #221 | Tragic 26.8% |
| Bolivians | 8.3 /100 | #222 | Tragic 26.8% |
| Jordanians | 8.0 /100 | #223 | Tragic 26.8% |
| Immigrants from Argentina | 7.2 /100 | #224 | Tragic 26.8% |
| Immigrants from Ireland | 6.5 /100 | #225 | Tragic 26.9% |
| Asians | 5.9 /100 | #226 | Tragic 26.9% |
| Spaniards | 5.6 /100 | #227 | Tragic 27.0% |
| Immigrants from Turkey | 5.6 /100 | #228 | Tragic 27.0% |
Immigrants from Spain Wage/Income Gap Correlation Summary
| Measurement | Immigrants from Spain Data | Wage/Income Gap Data |
| Minimum | 0.029% | 6.9% |
| Maximum | 10.2% | 90.7% |
| Range | 10.2% | 83.8% |
| Mean | 2.7% | 34.9% |
| Median | 1.9% | 28.8% |
| Interquartile 25% (IQ1) | 0.96% | 25.2% |
| Interquartile 75% (IQ3) | 4.2% | 42.5% |
| Interquartile Range (IQR) | 3.2% | 17.4% |
| Standard Deviation (Sample) | 2.4% | 16.6% |
| Standard Deviation (Population) | 2.4% | 16.5% |
Correlation Details
| Immigrants from Spain Percentile | Sample Size | Wage/Income Gap |
[ 0.0% - 0.5% ] 0.029% | 140,383,268 | 24.8% |
[ 0.0% - 0.5% ] 0.085% | 43,917,236 | 26.5% |
[ 0.0% - 0.5% ] 0.14% | 27,694,629 | 23.5% |
[ 0.0% - 0.5% ] 0.21% | 8,673,108 | 27.4% |
[ 0.0% - 0.5% ] 0.26% | 5,935,183 | 26.5% |
[ 0.0% - 0.5% ] 0.33% | 3,600,127 | 28.3% |
[ 0.0% - 0.5% ] 0.39% | 2,041,442 | 27.1% |
[ 0.0% - 0.5% ] 0.45% | 1,427,630 | 35.7% |
[ 0.5% - 1.0% ] 0.51% | 1,890,410 | 25.4% |
[ 0.5% - 1.0% ] 0.57% | 878,162 | 26.2% |
[ 0.5% - 1.0% ] 0.63% | 691,250 | 26.0% |
[ 0.5% - 1.0% ] 0.69% | 342,900 | 27.9% |
[ 0.5% - 1.0% ] 0.74% | 181,609 | 25.1% |
[ 0.5% - 1.0% ] 0.81% | 291,735 | 29.4% |
[ 0.5% - 1.0% ] 0.86% | 212,381 | 18.1% |
[ 0.5% - 1.0% ] 0.93% | 167,529 | 30.3% |
[ 0.5% - 1.0% ] 0.98% | 158,665 | 32.3% |
[ 1.0% - 1.5% ] 1.05% | 175,975 | 29.1% |
[ 1.0% - 1.5% ] 1.10% | 176,083 | 33.1% |
[ 1.0% - 1.5% ] 1.16% | 80,484 | 26.5% |
[ 1.0% - 1.5% ] 1.23% | 68,154 | 38.1% |
[ 1.0% - 1.5% ] 1.27% | 39,392 | 23.0% |
[ 1.0% - 1.5% ] 1.35% | 93,796 | 16.7% |
[ 1.0% - 1.5% ] 1.44% | 627 | 54.5% |
[ 1.0% - 1.5% ] 1.46% | 97,087 | 25.6% |
[ 1.5% - 2.0% ] 1.53% | 25,385 | 44.0% |
[ 1.5% - 2.0% ] 1.58% | 2,784 | 22.4% |
[ 1.5% - 2.0% ] 1.66% | 2,714 | 33.2% |
[ 1.5% - 2.0% ] 1.70% | 6,600 | 18.6% |
[ 1.5% - 2.0% ] 1.74% | 10,260 | 24.8% |
[ 1.5% - 2.0% ] 1.84% | 60,116 | 37.4% |
[ 1.5% - 2.0% ] 1.87% | 9,495 | 37.5% |
[ 1.5% - 2.0% ] 1.92% | 468 | 24.9% |
[ 2.0% - 2.5% ] 2.01% | 52,719 | 20.6% |
[ 2.0% - 2.5% ] 2.04% | 5,881 | 11.6% |
[ 2.0% - 2.5% ] 2.20% | 90,500 | 34.5% |
[ 2.0% - 2.5% ] 2.22% | 270 | 44.0% |
[ 2.0% - 2.5% ] 2.42% | 2,069 | 41.8% |
[ 2.0% - 2.5% ] 2.48% | 1,575 | 47.6% |
[ 2.5% - 3.0% ] 2.72% | 7,795 | 13.0% |
[ 2.5% - 3.0% ] 2.83% | 14,441 | 42.0% |
[ 2.5% - 3.0% ] 2.90% | 19,922 | 69.0% |
[ 2.5% - 3.0% ] 2.97% | 1,952 | 29.4% |
[ 3.0% - 3.5% ] 3.27% | 3,698 | 36.1% |
[ 3.0% - 3.5% ] 3.45% | 1,014 | 6.9% |
[ 3.5% - 4.0% ] 3.75% | 22,540 | 28.1% |
[ 3.5% - 4.0% ] 3.89% | 565 | 25.4% |
[ 4.0% - 4.5% ] 4.05% | 5,500 | 41.4% |
[ 4.0% - 4.5% ] 4.29% | 2,308 | 43.0% |
[ 4.0% - 4.5% ] 4.34% | 4,098 | 50.8% |
[ 4.5% - 5.0% ] 4.63% | 2,227 | 28.6% |
[ 4.5% - 5.0% ] 4.95% | 1,333 | 57.8% |
[ 4.5% - 5.0% ] 4.99% | 1,123 | 25.3% |
[ 5.0% - 5.5% ] 5.10% | 824 | 55.6% |
[ 5.0% - 5.5% ] 5.44% | 14,639 | 62.2% |
[ 5.0% - 5.5% ] 5.46% | 14,572 | 62.5% |
[ 5.5% - 6.0% ] 5.56% | 54 | 28.4% |
[ 5.5% - 6.0% ] 5.57% | 2,368 | 7.8% |
[ 6.0% - 6.5% ] 6.48% | 633 | 90.7% |
[ 6.5% - 7.0% ] 6.61% | 681 | 64.3% |
[ 7.0% - 7.5% ] 7.00% | 714 | 21.3% |
[ 9.0% - 9.5% ] 9.47% | 697 | 66.6% |
[ 9.5% - 10.0% ] 9.61% | 281 | 63.3% |
[ 10.0% - 10.5% ] 10.19% | 932 | 65.2% |