Immigrants from Spain Married-couple Households
COMPARE
Immigrants from Spain
Select to Compare
Married-couple Households
Immigrants from Spain Married-couple Households
45.3%
MARRIED-COUPLE HOUSEHOLDS
7.3/ 100
METRIC RATING
211th/ 347
METRIC RANK
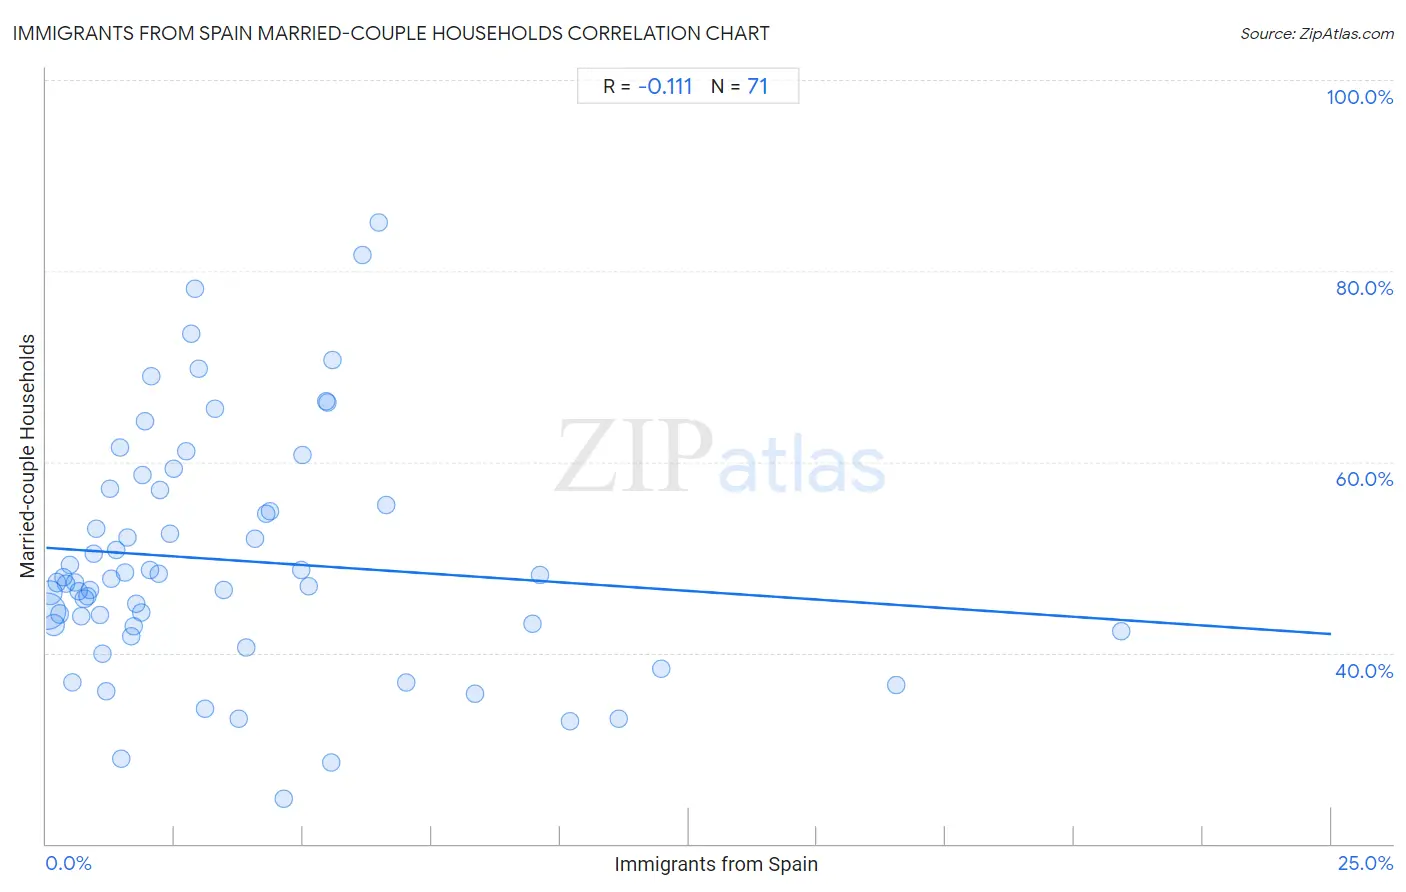
Immigrants from Spain Married-couple Households Correlation Chart
The statistical analysis conducted on geographies consisting of 239,598,425 people shows a poor negative correlation between the proportion of Immigrants from Spain and percentage of married-couple family households in the United States with a correlation coefficient (R) of -0.111 and weighted average of 45.3%. On average, for every 1% (one percent) increase in Immigrants from Spain within a typical geography, there is a decrease of 0.36% in percentage of married-couple family households.
It is essential to understand that the correlation between the percentage of Immigrants from Spain and percentage of married-couple family households does not imply a direct cause-and-effect relationship. It remains uncertain whether the presence of Immigrants from Spain influences an upward or downward trend in the level of percentage of married-couple family households within an area, or if Immigrants from Spain simply ended up residing in those areas with higher or lower levels of percentage of married-couple family households due to other factors.
Demographics Similar to Immigrants from Spain by Married-couple Households
In terms of married-couple households, the demographic groups most similar to Immigrants from Spain are Cuban (45.4%, a difference of 0.050%), Creek (45.3%, a difference of 0.13%), Immigrants from Uzbekistan (45.4%, a difference of 0.14%), Immigrants from France (45.4%, a difference of 0.19%), and Hispanic or Latino (45.4%, a difference of 0.19%).
| Demographics | Rating | Rank | Married-couple Households |
| Aleuts | 12.5 /100 | #204 | Poor 45.6% |
| Nepalese | 11.9 /100 | #205 | Poor 45.6% |
| Uruguayans | 10.4 /100 | #206 | Poor 45.5% |
| Immigrants from France | 8.8 /100 | #207 | Tragic 45.4% |
| Hispanics or Latinos | 8.7 /100 | #208 | Tragic 45.4% |
| Immigrants from Uzbekistan | 8.4 /100 | #209 | Tragic 45.4% |
| Cubans | 7.7 /100 | #210 | Tragic 45.4% |
| Immigrants from Spain | 7.3 /100 | #211 | Tragic 45.3% |
| Creek | 6.4 /100 | #212 | Tragic 45.3% |
| Yakama | 5.8 /100 | #213 | Tragic 45.2% |
| Japanese | 5.7 /100 | #214 | Tragic 45.2% |
| Immigrants from Nepal | 5.6 /100 | #215 | Tragic 45.2% |
| Immigrants from Portugal | 5.6 /100 | #216 | Tragic 45.2% |
| Panamanians | 5.5 /100 | #217 | Tragic 45.2% |
| Immigrants from the Azores | 5.3 /100 | #218 | Tragic 45.2% |
Immigrants from Spain Married-couple Households Correlation Summary
| Measurement | Immigrants from Spain Data | Married-couple Households Data |
| Minimum | 0.029% | 24.7% |
| Maximum | 20.9% | 85.1% |
| Range | 20.9% | 60.3% |
| Mean | 3.6% | 49.7% |
| Median | 2.2% | 47.4% |
| Interquartile 25% (IQ1) | 1.0% | 42.8% |
| Interquartile 75% (IQ3) | 5.0% | 57.0% |
| Interquartile Range (IQR) | 3.9% | 14.2% |
| Standard Deviation (Sample) | 3.9% | 12.5% |
| Standard Deviation (Population) | 3.8% | 12.4% |
Correlation Details
| Immigrants from Spain Percentile | Sample Size | Married-couple Households |
[ 0.0% - 0.5% ] 0.029% | 140,382,396 | 44.3% |
[ 0.0% - 0.5% ] 0.085% | 43,920,051 | 46.3% |
[ 0.0% - 0.5% ] 0.14% | 27,679,657 | 43.0% |
[ 0.0% - 0.5% ] 0.21% | 8,647,937 | 47.3% |
[ 0.0% - 0.5% ] 0.26% | 5,926,656 | 44.0% |
[ 0.0% - 0.5% ] 0.33% | 3,601,666 | 47.9% |
[ 0.0% - 0.5% ] 0.39% | 2,041,442 | 47.2% |
[ 0.0% - 0.5% ] 0.45% | 1,428,051 | 49.2% |
[ 0.5% - 1.0% ] 0.51% | 1,888,223 | 36.9% |
[ 0.5% - 1.0% ] 0.57% | 888,349 | 47.4% |
[ 0.5% - 1.0% ] 0.63% | 691,250 | 46.5% |
[ 0.5% - 1.0% ] 0.69% | 335,508 | 43.8% |
[ 0.5% - 1.0% ] 0.74% | 185,471 | 45.7% |
[ 0.5% - 1.0% ] 0.81% | 291,564 | 45.9% |
[ 0.5% - 1.0% ] 0.86% | 213,573 | 46.5% |
[ 0.5% - 1.0% ] 0.93% | 169,833 | 50.4% |
[ 0.5% - 1.0% ] 0.98% | 160,565 | 53.0% |
[ 1.0% - 1.5% ] 1.05% | 175,975 | 44.0% |
[ 1.0% - 1.5% ] 1.10% | 177,669 | 39.9% |
[ 1.0% - 1.5% ] 1.16% | 81,660 | 36.0% |
[ 1.0% - 1.5% ] 1.23% | 68,154 | 57.2% |
[ 1.0% - 1.5% ] 1.27% | 39,392 | 47.7% |
[ 1.0% - 1.5% ] 1.35% | 99,638 | 50.8% |
[ 1.0% - 1.5% ] 1.44% | 627 | 61.5% |
[ 1.0% - 1.5% ] 1.46% | 97,568 | 29.0% |
[ 1.5% - 2.0% ] 1.53% | 25,385 | 48.4% |
[ 1.5% - 2.0% ] 1.58% | 6,512 | 52.0% |
[ 1.5% - 2.0% ] 1.66% | 3,133 | 41.7% |
[ 1.5% - 2.0% ] 1.69% | 7,493 | 42.8% |
[ 1.5% - 2.0% ] 1.74% | 10,260 | 45.1% |
[ 1.5% - 2.0% ] 1.84% | 60,116 | 44.2% |
[ 1.5% - 2.0% ] 1.87% | 9,495 | 58.7% |
[ 1.5% - 2.0% ] 1.92% | 468 | 64.3% |
[ 2.0% - 2.5% ] 2.01% | 53,976 | 48.7% |
[ 2.0% - 2.5% ] 2.04% | 5,881 | 69.0% |
[ 2.0% - 2.5% ] 2.20% | 90,500 | 48.2% |
[ 2.0% - 2.5% ] 2.22% | 270 | 57.0% |
[ 2.0% - 2.5% ] 2.42% | 2,069 | 52.4% |
[ 2.0% - 2.5% ] 2.48% | 1,575 | 59.3% |
[ 2.5% - 3.0% ] 2.72% | 7,795 | 61.1% |
[ 2.5% - 3.0% ] 2.83% | 14,441 | 73.4% |
[ 2.5% - 3.0% ] 2.90% | 19,922 | 78.2% |
[ 2.5% - 3.0% ] 2.96% | 2,801 | 69.8% |
[ 3.0% - 3.5% ] 3.09% | 194 | 34.1% |
[ 3.0% - 3.5% ] 3.27% | 3,698 | 65.5% |
[ 3.0% - 3.5% ] 3.45% | 1,014 | 46.6% |
[ 3.5% - 4.0% ] 3.75% | 23,340 | 33.1% |
[ 3.5% - 4.0% ] 3.89% | 565 | 40.6% |
[ 4.0% - 4.5% ] 4.05% | 5,500 | 51.9% |
[ 4.0% - 4.5% ] 4.29% | 2,308 | 54.6% |
[ 4.0% - 4.5% ] 4.34% | 4,098 | 54.9% |
[ 4.5% - 5.0% ] 4.63% | 2,227 | 24.7% |
[ 4.5% - 5.0% ] 4.95% | 1,475 | 48.6% |
[ 4.5% - 5.0% ] 4.99% | 1,123 | 60.7% |
[ 5.0% - 5.5% ] 5.10% | 824 | 46.9% |
[ 5.0% - 5.5% ] 5.44% | 14,639 | 66.3% |
[ 5.0% - 5.5% ] 5.46% | 14,572 | 66.2% |
[ 5.5% - 6.0% ] 5.56% | 54 | 28.6% |
[ 5.5% - 6.0% ] 5.57% | 2,368 | 70.7% |
[ 6.0% - 6.5% ] 6.16% | 146 | 81.6% |
[ 6.0% - 6.5% ] 6.48% | 633 | 85.1% |
[ 6.5% - 7.0% ] 6.61% | 681 | 55.5% |
[ 7.0% - 7.5% ] 7.00% | 714 | 36.8% |
[ 8.0% - 8.5% ] 8.33% | 84 | 35.7% |
[ 9.0% - 9.5% ] 9.47% | 697 | 43.1% |
[ 9.5% - 10.0% ] 9.61% | 281 | 48.1% |
[ 10.0% - 10.5% ] 10.19% | 932 | 32.9% |
[ 11.0% - 11.5% ] 11.14% | 368 | 33.1% |
[ 11.5% - 12.0% ] 11.96% | 418 | 38.3% |
[ 16.5% - 17.0% ] 16.54% | 266 | 36.7% |
[ 20.5% - 21.0% ] 20.92% | 239 | 42.2% |