Immigrants from Spain Disability
COMPARE
Immigrants from Spain
Select to Compare
Disability
Immigrants from Spain Disability
10.9%
DISABILITY
99.8/ 100
METRIC RATING
53rd/ 347
METRIC RANK
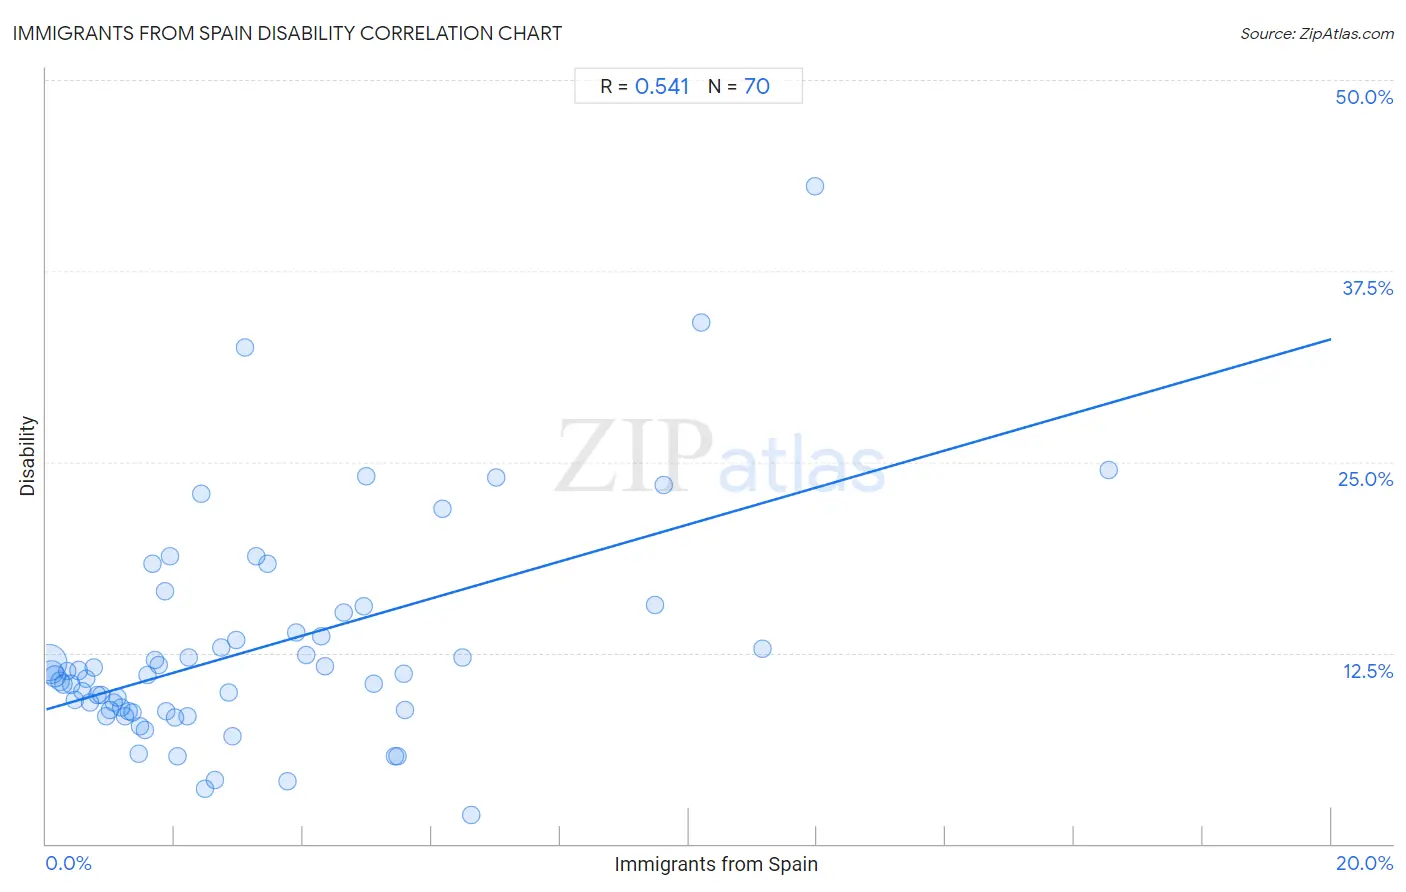
Immigrants from Spain Disability Correlation Chart
The statistical analysis conducted on geographies consisting of 239,685,180 people shows a substantial positive correlation between the proportion of Immigrants from Spain and percentage of population with a disability in the United States with a correlation coefficient (R) of 0.541 and weighted average of 10.9%. On average, for every 1% (one percent) increase in Immigrants from Spain within a typical geography, there is an increase of 1.2% in percentage of population with a disability.
It is essential to understand that the correlation between the percentage of Immigrants from Spain and percentage of population with a disability does not imply a direct cause-and-effect relationship. It remains uncertain whether the presence of Immigrants from Spain influences an upward or downward trend in the level of percentage of population with a disability within an area, or if Immigrants from Spain simply ended up residing in those areas with higher or lower levels of percentage of population with a disability due to other factors.
Demographics Similar to Immigrants from Spain by Disability
In terms of disability, the demographic groups most similar to Immigrants from Spain are Jordanian (10.9%, a difference of 0.0%), South American (10.9%, a difference of 0.020%), Peruvian (10.9%, a difference of 0.080%), Vietnamese (10.9%, a difference of 0.090%), and Immigrants from Saudi Arabia (10.9%, a difference of 0.090%).
| Demographics | Rating | Rank | Disability |
| Tongans | 99.9 /100 | #46 | Exceptional 10.8% |
| Taiwanese | 99.9 /100 | #47 | Exceptional 10.8% |
| Soviet Union | 99.9 /100 | #48 | Exceptional 10.9% |
| Vietnamese | 99.9 /100 | #49 | Exceptional 10.9% |
| Immigrants from Saudi Arabia | 99.9 /100 | #50 | Exceptional 10.9% |
| Peruvians | 99.8 /100 | #51 | Exceptional 10.9% |
| South Americans | 99.8 /100 | #52 | Exceptional 10.9% |
| Immigrants from Spain | 99.8 /100 | #53 | Exceptional 10.9% |
| Jordanians | 99.8 /100 | #54 | Exceptional 10.9% |
| Immigrants from El Salvador | 99.8 /100 | #55 | Exceptional 10.9% |
| Immigrants from Lithuania | 99.8 /100 | #56 | Exceptional 10.9% |
| Salvadorans | 99.8 /100 | #57 | Exceptional 10.9% |
| Immigrants from South America | 99.8 /100 | #58 | Exceptional 10.9% |
| Immigrants from Colombia | 99.7 /100 | #59 | Exceptional 10.9% |
| Zimbabweans | 99.7 /100 | #60 | Exceptional 10.9% |
Immigrants from Spain Disability Correlation Summary
| Measurement | Immigrants from Spain Data | Disability Data |
| Minimum | 0.029% | 1.9% |
| Maximum | 16.5% | 43.1% |
| Range | 16.5% | 41.2% |
| Mean | 3.2% | 12.7% |
| Median | 2.1% | 11.0% |
| Interquartile 25% (IQ1) | 1.0% | 8.7% |
| Interquartile 75% (IQ3) | 4.6% | 13.8% |
| Interquartile Range (IQR) | 3.6% | 5.1% |
| Standard Deviation (Sample) | 3.2% | 7.2% |
| Standard Deviation (Population) | 3.2% | 7.1% |
Correlation Details
| Immigrants from Spain Percentile | Sample Size | Disability |
[ 0.0% - 0.5% ] 0.029% | 140,388,875 | 11.9% |
[ 0.0% - 0.5% ] 0.085% | 43,924,215 | 11.2% |
[ 0.0% - 0.5% ] 0.14% | 27,698,673 | 11.0% |
[ 0.0% - 0.5% ] 0.21% | 8,674,942 | 10.7% |
[ 0.0% - 0.5% ] 0.26% | 5,936,340 | 10.5% |
[ 0.0% - 0.5% ] 0.33% | 3,601,666 | 11.3% |
[ 0.0% - 0.5% ] 0.39% | 2,041,442 | 10.4% |
[ 0.0% - 0.5% ] 0.45% | 1,431,260 | 9.4% |
[ 0.5% - 1.0% ] 0.51% | 1,891,367 | 11.3% |
[ 0.5% - 1.0% ] 0.57% | 890,234 | 10.0% |
[ 0.5% - 1.0% ] 0.63% | 691,250 | 10.8% |
[ 0.5% - 1.0% ] 0.69% | 344,079 | 9.3% |
[ 0.5% - 1.0% ] 0.74% | 185,471 | 11.6% |
[ 0.5% - 1.0% ] 0.81% | 293,741 | 9.8% |
[ 0.5% - 1.0% ] 0.86% | 214,031 | 9.7% |
[ 0.5% - 1.0% ] 0.93% | 169,833 | 8.4% |
[ 0.5% - 1.0% ] 0.98% | 160,565 | 8.7% |
[ 1.0% - 1.5% ] 1.05% | 175,975 | 9.3% |
[ 1.0% - 1.5% ] 1.10% | 177,669 | 9.6% |
[ 1.0% - 1.5% ] 1.16% | 81,660 | 8.9% |
[ 1.0% - 1.5% ] 1.23% | 68,154 | 8.4% |
[ 1.0% - 1.5% ] 1.27% | 39,392 | 8.7% |
[ 1.0% - 1.5% ] 1.35% | 99,638 | 8.6% |
[ 1.0% - 1.5% ] 1.44% | 627 | 5.9% |
[ 1.0% - 1.5% ] 1.46% | 98,051 | 7.7% |
[ 1.5% - 2.0% ] 1.53% | 25,385 | 7.4% |
[ 1.5% - 2.0% ] 1.58% | 6,512 | 11.1% |
[ 1.5% - 2.0% ] 1.66% | 3,133 | 18.3% |
[ 1.5% - 2.0% ] 1.69% | 7,493 | 12.0% |
[ 1.5% - 2.0% ] 1.74% | 10,260 | 11.7% |
[ 1.5% - 2.0% ] 1.84% | 60,728 | 16.5% |
[ 1.5% - 2.0% ] 1.87% | 9,495 | 8.7% |
[ 1.5% - 2.0% ] 1.92% | 468 | 18.8% |
[ 2.0% - 2.5% ] 2.01% | 53,976 | 8.3% |
[ 2.0% - 2.5% ] 2.04% | 5,881 | 5.8% |
[ 2.0% - 2.5% ] 2.20% | 90,500 | 8.4% |
[ 2.0% - 2.5% ] 2.22% | 270 | 12.2% |
[ 2.0% - 2.5% ] 2.42% | 2,069 | 22.9% |
[ 2.0% - 2.5% ] 2.48% | 1,575 | 3.6% |
[ 2.5% - 3.0% ] 2.62% | 191 | 4.2% |
[ 2.5% - 3.0% ] 2.72% | 7,795 | 12.8% |
[ 2.5% - 3.0% ] 2.83% | 14,441 | 9.9% |
[ 2.5% - 3.0% ] 2.90% | 19,922 | 7.1% |
[ 2.5% - 3.0% ] 2.96% | 2,801 | 13.3% |
[ 3.0% - 3.5% ] 3.09% | 194 | 32.5% |
[ 3.0% - 3.5% ] 3.27% | 3,698 | 18.8% |
[ 3.0% - 3.5% ] 3.45% | 1,014 | 18.3% |
[ 3.5% - 4.0% ] 3.75% | 23,340 | 4.1% |
[ 3.5% - 4.0% ] 3.89% | 565 | 13.8% |
[ 4.0% - 4.5% ] 4.05% | 5,500 | 12.3% |
[ 4.0% - 4.5% ] 4.29% | 2,308 | 13.6% |
[ 4.0% - 4.5% ] 4.34% | 4,098 | 11.6% |
[ 4.5% - 5.0% ] 4.63% | 2,227 | 15.1% |
[ 4.5% - 5.0% ] 4.95% | 1,475 | 15.5% |
[ 4.5% - 5.0% ] 4.99% | 1,123 | 24.1% |
[ 5.0% - 5.5% ] 5.10% | 824 | 10.4% |
[ 5.0% - 5.5% ] 5.44% | 14,639 | 5.7% |
[ 5.0% - 5.5% ] 5.46% | 14,572 | 5.8% |
[ 5.5% - 6.0% ] 5.56% | 54 | 11.1% |
[ 5.5% - 6.0% ] 5.57% | 2,368 | 8.7% |
[ 6.0% - 6.5% ] 6.16% | 146 | 21.9% |
[ 6.0% - 6.5% ] 6.48% | 633 | 12.2% |
[ 6.5% - 7.0% ] 6.61% | 681 | 1.9% |
[ 7.0% - 7.5% ] 7.00% | 714 | 23.9% |
[ 9.0% - 9.5% ] 9.47% | 697 | 15.6% |
[ 9.5% - 10.0% ] 9.61% | 281 | 23.5% |
[ 10.0% - 10.5% ] 10.19% | 932 | 34.1% |
[ 11.0% - 11.5% ] 11.14% | 368 | 12.8% |
[ 11.5% - 12.0% ] 11.96% | 418 | 43.1% |
[ 16.5% - 17.0% ] 16.54% | 266 | 24.4% |