Immigrants from Northern Africa 2 or more Vehicles in Household
COMPARE
Immigrants from Northern Africa
Select to Compare
2 or more Vehicles in Household
Immigrants from Northern Africa 2 or more Vehicles in Household
52.3%
2+ VEHICLES AVAILABLE
0.4/ 100
METRIC RATING
262nd/ 347
METRIC RANK
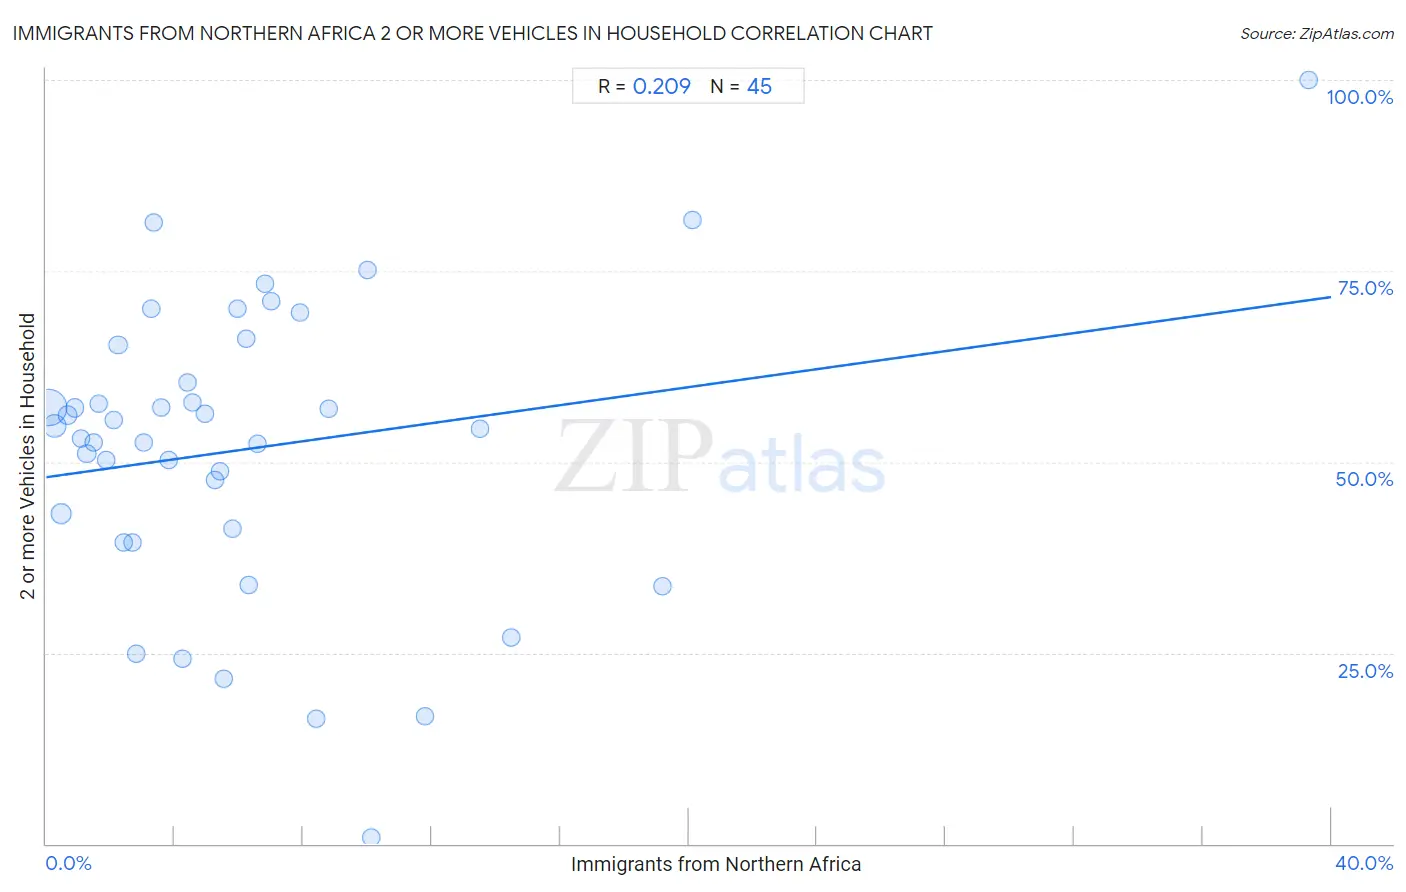
Immigrants from Northern Africa 2 or more Vehicles in Household Correlation Chart
The statistical analysis conducted on geographies consisting of 321,098,836 people shows a weak positive correlation between the proportion of Immigrants from Northern Africa and percentage of households with 2 or more vehicles available in the United States with a correlation coefficient (R) of 0.209 and weighted average of 52.3%. On average, for every 1% (one percent) increase in Immigrants from Northern Africa within a typical geography, there is an increase of 0.59% in percentage of households with 2 or more vehicles available.
It is essential to understand that the correlation between the percentage of Immigrants from Northern Africa and percentage of households with 2 or more vehicles available does not imply a direct cause-and-effect relationship. It remains uncertain whether the presence of Immigrants from Northern Africa influences an upward or downward trend in the level of percentage of households with 2 or more vehicles available within an area, or if Immigrants from Northern Africa simply ended up residing in those areas with higher or lower levels of percentage of households with 2 or more vehicles available due to other factors.
Demographics Similar to Immigrants from Northern Africa by 2 or more Vehicles in Household
In terms of 2 or more vehicles in household, the demographic groups most similar to Immigrants from Northern Africa are Immigrants from Southern Europe (52.3%, a difference of 0.13%), Immigrants from Latvia (52.2%, a difference of 0.17%), Immigrants from Australia (52.4%, a difference of 0.20%), Immigrants from Bahamas (52.5%, a difference of 0.23%), and Alsatian (52.5%, a difference of 0.30%).
| Demographics | Rating | Rank | 2 or more Vehicles in Household |
| Uruguayans | 0.7 /100 | #255 | Tragic 52.7% |
| Immigrants from Eritrea | 0.7 /100 | #256 | Tragic 52.6% |
| Immigrants from Hong Kong | 0.6 /100 | #257 | Tragic 52.6% |
| Central American Indians | 0.6 /100 | #258 | Tragic 52.5% |
| Alsatians | 0.6 /100 | #259 | Tragic 52.5% |
| Immigrants from Bahamas | 0.5 /100 | #260 | Tragic 52.5% |
| Immigrants from Australia | 0.5 /100 | #261 | Tragic 52.4% |
| Immigrants from Northern Africa | 0.4 /100 | #262 | Tragic 52.3% |
| Immigrants from Southern Europe | 0.4 /100 | #263 | Tragic 52.3% |
| Immigrants from Latvia | 0.4 /100 | #264 | Tragic 52.2% |
| Immigrants from Congo | 0.3 /100 | #265 | Tragic 52.1% |
| Immigrants from France | 0.2 /100 | #266 | Tragic 52.0% |
| Immigrants from Colombia | 0.2 /100 | #267 | Tragic 52.0% |
| Pima | 0.2 /100 | #268 | Tragic 52.0% |
| Hondurans | 0.2 /100 | #269 | Tragic 52.0% |
Immigrants from Northern Africa 2 or more Vehicles in Household Correlation Summary
| Measurement | Immigrants from Northern Africa Data | 2 or more Vehicles in Household Data |
| Minimum | 0.085% | 0.83% |
| Maximum | 39.3% | 100.0% |
| Range | 39.2% | 99.2% |
| Mean | 6.3% | 51.7% |
| Median | 4.6% | 54.3% |
| Interquartile 25% (IQ1) | 2.2% | 40.4% |
| Interquartile 75% (IQ3) | 7.4% | 62.8% |
| Interquartile Range (IQR) | 5.3% | 22.4% |
| Standard Deviation (Sample) | 6.8% | 19.3% |
| Standard Deviation (Population) | 6.8% | 19.1% |
Correlation Details
| Immigrants from Northern Africa Percentile | Sample Size | 2 or more Vehicles in Household |
[ 0.0% - 0.5% ] 0.085% | 203,333,585 | 57.2% |
[ 0.0% - 0.5% ] 0.27% | 61,391,227 | 54.7% |
[ 0.0% - 0.5% ] 0.46% | 28,711,616 | 43.3% |
[ 0.5% - 1.0% ] 0.68% | 10,885,019 | 56.1% |
[ 0.5% - 1.0% ] 0.88% | 5,059,123 | 57.1% |
[ 1.0% - 1.5% ] 1.09% | 4,024,794 | 53.1% |
[ 1.0% - 1.5% ] 1.26% | 2,404,850 | 51.0% |
[ 1.0% - 1.5% ] 1.48% | 1,354,069 | 52.5% |
[ 1.5% - 2.0% ] 1.64% | 831,150 | 57.5% |
[ 1.5% - 2.0% ] 1.86% | 919,315 | 50.2% |
[ 2.0% - 2.5% ] 2.09% | 220,919 | 55.5% |
[ 2.0% - 2.5% ] 2.24% | 441,663 | 65.3% |
[ 2.0% - 2.5% ] 2.43% | 165,135 | 39.4% |
[ 2.5% - 3.0% ] 2.70% | 187,097 | 39.5% |
[ 2.5% - 3.0% ] 2.81% | 389,486 | 24.8% |
[ 3.0% - 3.5% ] 3.04% | 58,931 | 52.6% |
[ 3.0% - 3.5% ] 3.27% | 58,808 | 70.1% |
[ 3.0% - 3.5% ] 3.35% | 14,102 | 81.4% |
[ 3.5% - 4.0% ] 3.58% | 24,408 | 57.1% |
[ 3.5% - 4.0% ] 3.80% | 22,324 | 50.2% |
[ 4.0% - 4.5% ] 4.22% | 47,320 | 24.2% |
[ 4.0% - 4.5% ] 4.41% | 12,424 | 60.4% |
[ 4.5% - 5.0% ] 4.56% | 33,627 | 57.7% |
[ 4.5% - 5.0% ] 4.96% | 46,887 | 56.3% |
[ 5.0% - 5.5% ] 5.24% | 223,532 | 47.6% |
[ 5.0% - 5.5% ] 5.41% | 3,162 | 48.8% |
[ 5.5% - 6.0% ] 5.53% | 51,856 | 21.6% |
[ 5.5% - 6.0% ] 5.80% | 3,313 | 41.3% |
[ 5.5% - 6.0% ] 5.96% | 151 | 70.0% |
[ 6.0% - 6.5% ] 6.22% | 8,815 | 66.2% |
[ 6.0% - 6.5% ] 6.32% | 140,994 | 33.9% |
[ 6.5% - 7.0% ] 6.58% | 5,000 | 52.4% |
[ 6.5% - 7.0% ] 6.82% | 1,363 | 73.4% |
[ 6.5% - 7.0% ] 6.99% | 143 | 71.0% |
[ 7.5% - 8.0% ] 7.90% | 6,938 | 69.5% |
[ 8.0% - 8.5% ] 8.40% | 750 | 16.3% |
[ 8.5% - 9.0% ] 8.81% | 1,339 | 56.9% |
[ 10.0% - 10.5% ] 10.02% | 5,751 | 75.2% |
[ 10.0% - 10.5% ] 10.12% | 1,206 | 0.83% |
[ 11.5% - 12.0% ] 11.78% | 3,056 | 16.8% |
[ 13.0% - 13.5% ] 13.49% | 1,394 | 54.3% |
[ 14.0% - 14.5% ] 14.46% | 332 | 27.0% |
[ 19.0% - 19.5% ] 19.16% | 981 | 33.8% |
[ 20.0% - 20.5% ] 20.12% | 825 | 81.7% |
[ 39.0% - 39.5% ] 39.29% | 56 | 100.0% |