Immigrants from Northern Africa Married-couple Households
COMPARE
Immigrants from Northern Africa
Select to Compare
Married-couple Households
Immigrants from Northern Africa Married-couple Households
46.0%
MARRIED-COUPLE HOUSEHOLDS
24.6/ 100
METRIC RATING
192nd/ 347
METRIC RANK
Immigrants from Northern Africa Married-couple Households Correlation Chart
The statistical analysis conducted on geographies consisting of 321,083,250 people shows a moderate negative correlation between the proportion of Immigrants from Northern Africa and percentage of married-couple family households in the United States with a correlation coefficient (R) of -0.401 and weighted average of 46.0%. On average, for every 1% (one percent) increase in Immigrants from Northern Africa within a typical geography, there is a decrease of 0.85% in percentage of married-couple family households.
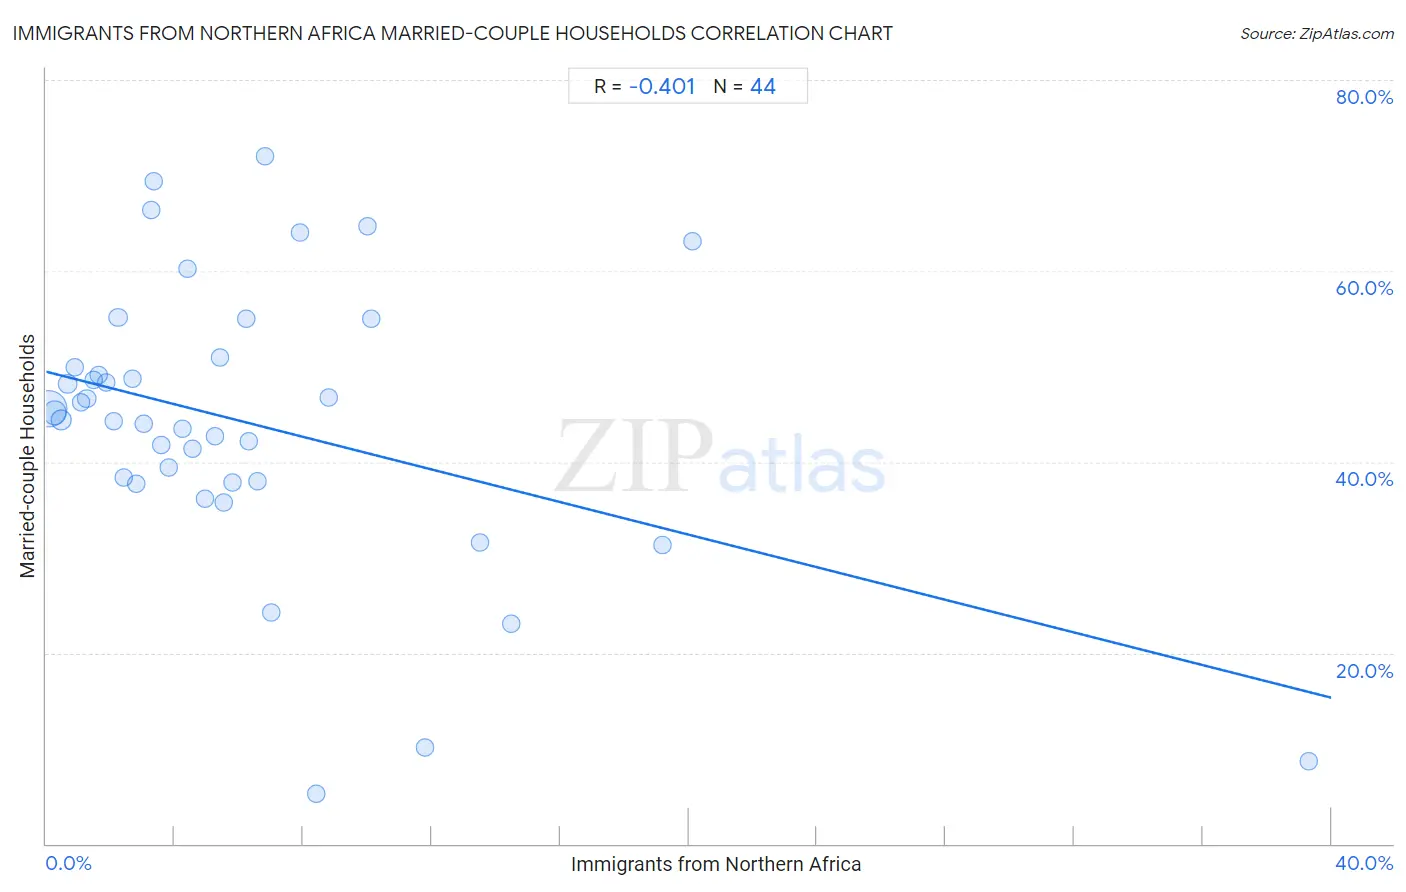
It is essential to understand that the correlation between the percentage of Immigrants from Northern Africa and percentage of married-couple family households does not imply a direct cause-and-effect relationship. It remains uncertain whether the presence of Immigrants from Northern Africa influences an upward or downward trend in the level of percentage of married-couple family households within an area, or if Immigrants from Northern Africa simply ended up residing in those areas with higher or lower levels of percentage of married-couple family households due to other factors.
Demographics Similar to Immigrants from Northern Africa by Married-couple Households
In terms of married-couple households, the demographic groups most similar to Immigrants from Northern Africa are Choctaw (46.0%, a difference of 0.020%), Immigrants from Kuwait (46.0%, a difference of 0.050%), Taiwanese (45.9%, a difference of 0.060%), Mexican American Indian (45.9%, a difference of 0.070%), and Chickasaw (45.9%, a difference of 0.10%).
| Demographics | Rating | Rank | Married-couple Households |
| Brazilians | 35.9 /100 | #185 | Fair 46.2% |
| Albanians | 31.1 /100 | #186 | Fair 46.1% |
| Fijians | 29.2 /100 | #187 | Fair 46.1% |
| South American Indians | 28.4 /100 | #188 | Fair 46.0% |
| Immigrants from Latvia | 26.9 /100 | #189 | Fair 46.0% |
| Immigrants from Kuwait | 25.6 /100 | #190 | Fair 46.0% |
| Choctaw | 24.9 /100 | #191 | Fair 46.0% |
| Immigrants from Northern Africa | 24.6 /100 | #192 | Fair 46.0% |
| Taiwanese | 23.4 /100 | #193 | Fair 45.9% |
| Mexican American Indians | 23.3 /100 | #194 | Fair 45.9% |
| Chickasaw | 22.7 /100 | #195 | Fair 45.9% |
| Immigrants from South America | 22.2 /100 | #196 | Fair 45.9% |
| Cambodians | 21.3 /100 | #197 | Fair 45.9% |
| Ottawa | 19.4 /100 | #198 | Poor 45.8% |
| Carpatho Rusyns | 15.7 /100 | #199 | Poor 45.7% |
Immigrants from Northern Africa Married-couple Households Correlation Summary
| Measurement | Immigrants from Northern Africa Data | Married-couple Households Data |
| Minimum | 0.085% | 5.3% |
| Maximum | 39.3% | 72.0% |
| Range | 39.2% | 66.8% |
| Mean | 6.3% | 44.1% |
| Median | 4.5% | 44.8% |
| Interquartile 25% (IQ1) | 2.2% | 37.9% |
| Interquartile 75% (IQ3) | 7.4% | 50.5% |
| Interquartile Range (IQR) | 5.3% | 12.6% |
| Standard Deviation (Sample) | 6.9% | 14.7% |
| Standard Deviation (Population) | 6.8% | 14.6% |
Correlation Details
| Immigrants from Northern Africa Percentile | Sample Size | Married-couple Households |
[ 0.0% - 0.5% ] 0.085% | 203,327,984 | 45.6% |
[ 0.0% - 0.5% ] 0.27% | 61,379,571 | 45.2% |
[ 0.0% - 0.5% ] 0.46% | 28,711,616 | 44.4% |
[ 0.5% - 1.0% ] 0.68% | 10,885,019 | 48.1% |
[ 0.5% - 1.0% ] 0.88% | 5,059,123 | 49.9% |
[ 1.0% - 1.5% ] 1.09% | 4,024,794 | 46.2% |
[ 1.0% - 1.5% ] 1.26% | 2,404,850 | 46.6% |
[ 1.0% - 1.5% ] 1.48% | 1,354,069 | 48.6% |
[ 1.5% - 2.0% ] 1.64% | 831,150 | 49.1% |
[ 1.5% - 2.0% ] 1.86% | 919,315 | 48.3% |
[ 2.0% - 2.5% ] 2.09% | 220,919 | 44.3% |
[ 2.0% - 2.5% ] 2.24% | 441,663 | 55.2% |
[ 2.0% - 2.5% ] 2.43% | 165,135 | 38.4% |
[ 2.5% - 3.0% ] 2.70% | 187,097 | 48.7% |
[ 2.5% - 3.0% ] 2.81% | 389,486 | 37.7% |
[ 3.0% - 3.5% ] 3.04% | 58,931 | 44.0% |
[ 3.0% - 3.5% ] 3.27% | 58,808 | 66.3% |
[ 3.0% - 3.5% ] 3.35% | 14,102 | 69.4% |
[ 3.5% - 4.0% ] 3.58% | 24,408 | 41.8% |
[ 3.5% - 4.0% ] 3.80% | 22,324 | 39.5% |
[ 4.0% - 4.5% ] 4.23% | 49,142 | 43.4% |
[ 4.0% - 4.5% ] 4.41% | 12,424 | 60.2% |
[ 4.5% - 5.0% ] 4.56% | 33,627 | 41.3% |
[ 4.5% - 5.0% ] 4.96% | 46,887 | 36.1% |
[ 5.0% - 5.5% ] 5.24% | 223,532 | 42.7% |
[ 5.0% - 5.5% ] 5.41% | 3,162 | 51.0% |
[ 5.5% - 6.0% ] 5.53% | 51,856 | 35.7% |
[ 5.5% - 6.0% ] 5.80% | 3,313 | 37.9% |
[ 6.0% - 6.5% ] 6.22% | 8,815 | 55.0% |
[ 6.0% - 6.5% ] 6.32% | 140,994 | 42.2% |
[ 6.5% - 7.0% ] 6.58% | 5,000 | 38.0% |
[ 6.5% - 7.0% ] 6.82% | 1,363 | 72.0% |
[ 6.5% - 7.0% ] 6.99% | 143 | 24.2% |
[ 7.5% - 8.0% ] 7.90% | 6,938 | 64.0% |
[ 8.0% - 8.5% ] 8.40% | 750 | 5.3% |
[ 8.5% - 9.0% ] 8.81% | 1,339 | 46.8% |
[ 10.0% - 10.5% ] 10.02% | 5,751 | 64.7% |
[ 10.0% - 10.5% ] 10.12% | 1,206 | 55.0% |
[ 11.5% - 12.0% ] 11.78% | 3,056 | 10.0% |
[ 13.0% - 13.5% ] 13.49% | 1,394 | 31.6% |
[ 14.0% - 14.5% ] 14.46% | 332 | 23.0% |
[ 19.0% - 19.5% ] 19.16% | 981 | 31.3% |
[ 20.0% - 20.5% ] 20.12% | 825 | 63.1% |
[ 39.0% - 39.5% ] 39.29% | 56 | 8.7% |