Immigrants from Northern Africa 1 or more Vehicles in Household
COMPARE
Immigrants from Northern Africa
Select to Compare
1 or more Vehicles in Household
Immigrants from Northern Africa 1 or more Vehicles in Household
87.4%
1+ VEHICLES AVAILABLE
0.2/ 100
METRIC RATING
273rd/ 347
METRIC RANK
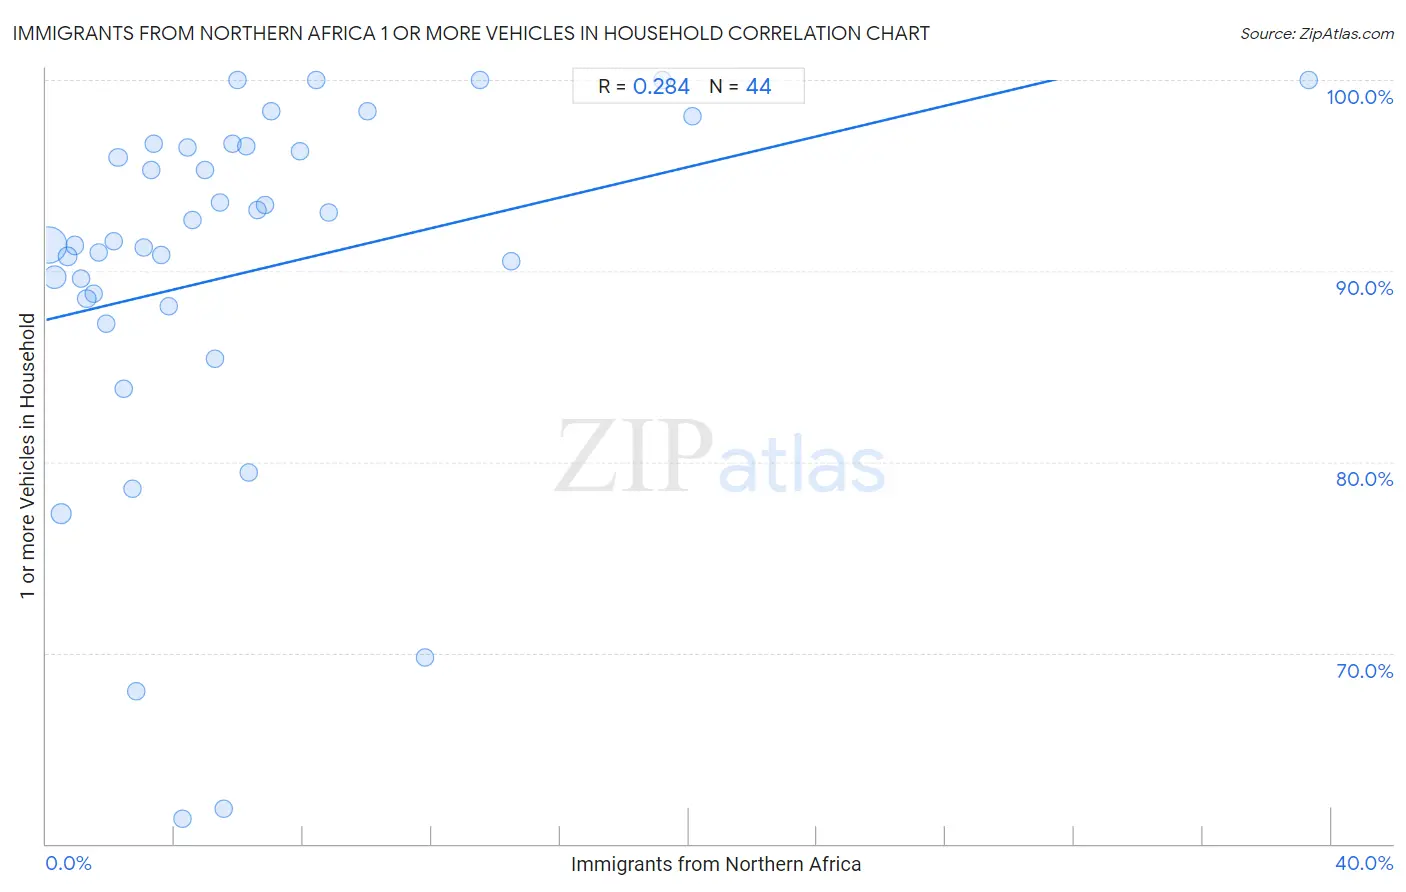
Immigrants from Northern Africa 1 or more Vehicles in Household Correlation Chart
The statistical analysis conducted on geographies consisting of 321,103,930 people shows a weak positive correlation between the proportion of Immigrants from Northern Africa and percentage of households with 1 or more vehicles available in the United States with a correlation coefficient (R) of 0.284 and weighted average of 87.4%. On average, for every 1% (one percent) increase in Immigrants from Northern Africa within a typical geography, there is an increase of 0.40% in percentage of households with 1 or more vehicles available.
It is essential to understand that the correlation between the percentage of Immigrants from Northern Africa and percentage of households with 1 or more vehicles available does not imply a direct cause-and-effect relationship. It remains uncertain whether the presence of Immigrants from Northern Africa influences an upward or downward trend in the level of percentage of households with 1 or more vehicles available within an area, or if Immigrants from Northern Africa simply ended up residing in those areas with higher or lower levels of percentage of households with 1 or more vehicles available due to other factors.
Demographics Similar to Immigrants from Northern Africa by 1 or more Vehicles in Household
In terms of 1 or more vehicles in household, the demographic groups most similar to Immigrants from Northern Africa are Immigrants from Morocco (87.4%, a difference of 0.030%), Aleut (87.5%, a difference of 0.040%), Panamanian (87.5%, a difference of 0.11%), Bermudan (87.5%, a difference of 0.11%), and Immigrants from Africa (87.6%, a difference of 0.12%).
| Demographics | Rating | Rank | 1 or more Vehicles in Household |
| Israelis | 0.3 /100 | #266 | Tragic 87.7% |
| Immigrants from Colombia | 0.3 /100 | #267 | Tragic 87.6% |
| Immigrants from Europe | 0.2 /100 | #268 | Tragic 87.6% |
| Immigrants from Africa | 0.2 /100 | #269 | Tragic 87.6% |
| Panamanians | 0.2 /100 | #270 | Tragic 87.5% |
| Bermudans | 0.2 /100 | #271 | Tragic 87.5% |
| Aleuts | 0.2 /100 | #272 | Tragic 87.5% |
| Immigrants from Northern Africa | 0.2 /100 | #273 | Tragic 87.4% |
| Immigrants from Morocco | 0.1 /100 | #274 | Tragic 87.4% |
| Immigrants from Singapore | 0.1 /100 | #275 | Tragic 87.2% |
| Immigrants from France | 0.1 /100 | #276 | Tragic 87.1% |
| Alsatians | 0.1 /100 | #277 | Tragic 87.1% |
| Immigrants from Southern Europe | 0.1 /100 | #278 | Tragic 87.1% |
| Immigrants from Albania | 0.1 /100 | #279 | Tragic 87.1% |
| Immigrants from Croatia | 0.0 /100 | #280 | Tragic 87.0% |
Immigrants from Northern Africa 1 or more Vehicles in Household Correlation Summary
| Measurement | Immigrants from Northern Africa Data | 1 or more Vehicles in Household Data |
| Minimum | 0.085% | 61.3% |
| Maximum | 39.3% | 100.0% |
| Range | 39.2% | 38.7% |
| Mean | 6.2% | 89.9% |
| Median | 4.5% | 91.5% |
| Interquartile 25% (IQ1) | 2.2% | 88.3% |
| Interquartile 75% (IQ3) | 6.9% | 96.5% |
| Interquartile Range (IQR) | 4.7% | 8.1% |
| Standard Deviation (Sample) | 6.9% | 9.7% |
| Standard Deviation (Population) | 6.8% | 9.6% |
Correlation Details
| Immigrants from Northern Africa Percentile | Sample Size | 1 or more Vehicles in Household |
[ 0.0% - 0.5% ] 0.085% | 203,333,585 | 91.3% |
[ 0.0% - 0.5% ] 0.27% | 61,395,705 | 89.7% |
[ 0.0% - 0.5% ] 0.46% | 28,711,616 | 77.3% |
[ 0.5% - 1.0% ] 0.68% | 10,885,019 | 90.8% |
[ 0.5% - 1.0% ] 0.88% | 5,059,123 | 91.3% |
[ 1.0% - 1.5% ] 1.09% | 4,024,794 | 89.6% |
[ 1.0% - 1.5% ] 1.26% | 2,404,850 | 88.5% |
[ 1.0% - 1.5% ] 1.48% | 1,354,069 | 88.8% |
[ 1.5% - 2.0% ] 1.64% | 831,150 | 91.0% |
[ 1.5% - 2.0% ] 1.86% | 919,315 | 87.2% |
[ 2.0% - 2.5% ] 2.09% | 220,919 | 91.6% |
[ 2.0% - 2.5% ] 2.24% | 441,663 | 95.9% |
[ 2.0% - 2.5% ] 2.43% | 165,135 | 83.9% |
[ 2.5% - 3.0% ] 2.70% | 187,097 | 78.6% |
[ 2.5% - 3.0% ] 2.81% | 389,486 | 68.0% |
[ 3.0% - 3.5% ] 3.04% | 58,931 | 91.2% |
[ 3.0% - 3.5% ] 3.27% | 58,808 | 95.3% |
[ 3.0% - 3.5% ] 3.35% | 14,102 | 96.7% |
[ 3.5% - 4.0% ] 3.58% | 24,408 | 90.8% |
[ 3.5% - 4.0% ] 3.80% | 22,324 | 88.2% |
[ 4.0% - 4.5% ] 4.23% | 49,142 | 61.3% |
[ 4.0% - 4.5% ] 4.41% | 12,424 | 96.4% |
[ 4.5% - 5.0% ] 4.56% | 33,627 | 92.7% |
[ 4.5% - 5.0% ] 4.96% | 46,887 | 95.3% |
[ 5.0% - 5.5% ] 5.24% | 223,532 | 85.4% |
[ 5.0% - 5.5% ] 5.41% | 3,162 | 93.6% |
[ 5.5% - 6.0% ] 5.53% | 51,856 | 61.8% |
[ 5.5% - 6.0% ] 5.80% | 3,313 | 96.6% |
[ 5.5% - 6.0% ] 5.96% | 151 | 100.0% |
[ 6.0% - 6.5% ] 6.22% | 8,815 | 96.5% |
[ 6.0% - 6.5% ] 6.32% | 140,994 | 79.4% |
[ 6.5% - 7.0% ] 6.58% | 5,000 | 93.2% |
[ 6.5% - 7.0% ] 6.82% | 1,363 | 93.4% |
[ 6.5% - 7.0% ] 6.99% | 143 | 98.4% |
[ 7.5% - 8.0% ] 7.90% | 6,938 | 96.3% |
[ 8.0% - 8.5% ] 8.40% | 750 | 100.0% |
[ 8.5% - 9.0% ] 8.81% | 1,339 | 93.1% |
[ 10.0% - 10.5% ] 10.02% | 5,751 | 98.4% |
[ 11.5% - 12.0% ] 11.78% | 3,056 | 69.8% |
[ 13.0% - 13.5% ] 13.49% | 1,394 | 100.0% |
[ 14.0% - 14.5% ] 14.46% | 332 | 90.5% |
[ 19.0% - 19.5% ] 19.16% | 981 | 100.0% |
[ 20.0% - 20.5% ] 20.12% | 825 | 98.1% |
[ 39.0% - 39.5% ] 39.29% | 56 | 100.0% |