Immigrants from Northern Africa 3 or more Vehicles in Household

COMPARE

Immigrants from Northern Africa
Race
Ancestry
AfghanAfricanAlaska NativeAlaskan AthabascanAlbanianAleutAlsatianAmericanApacheArabArapahoArgentineanArmenianAssyrian/Chaldean/SyriacAustralianAustrianBahamianBangladeshiBarbadianBasqueBelgianBelizeanBermudanBhutaneseBlackfeetBolivianBrazilianBritishBritish West IndianBulgarianBurmeseCajunCambodianCanadianCape VerdeanCarpatho RusynCelticCentral AmericanCentral American IndianCherokeeCheyenneChickasawChileanChineseChippewaChoctawColombianColvilleComancheCosta RicanCreeCreekCroatianCrowCubanCypriotCzechCzechoslovakianDanishDelawareDominicanDutchDutch West IndianEastern EuropeanEcuadorianEgyptianEnglishEstonianEthiopianEuropeanFijianFilipinoFinnishFrenchFrench American IndianFrench CanadianGermanGerman RussianGhanaianGreekGuamanian/ChamorroGuatemalanGuyaneseHaitianHmongHonduranHopiHoumaHungarianIcelanderIndian (Asian)IndonesianInupiatIranianIraqiIrishIroquoisIsraeliItalianJamaicanJapaneseJordanianKenyanKiowaKoreanLaotianLatvianLebaneseLiberianLithuanianLumbeeLuxembourgerMacedonianMalaysianMalteseMarshalleseMenomineeMexicanMexican American IndianMongolianMoroccanNative HawaiianNavajoNepaleseNew ZealanderNicaraguanNigerianNorthern EuropeanNorwegianOkinawanOsageOttawaPaiutePakistaniPalestinianPanamanianParaguayanPennsylvania GermanPeruvianPimaPolishPortuguesePotawatomiPuebloPuerto RicanPuget Sound SalishRomanianRussianSalvadoranSamoanScandinavianScotch-IrishScottishSeminoleSenegaleseSerbianShoshoneSierra LeoneanSiouxSlavicSlovakSloveneSomaliSouth AfricanSouth AmericanSouth American IndianSoviet UnionSpaniardSpanishSpanish AmericanSpanish American IndianSri LankanSubsaharan AfricanSudaneseSwedishSwissSyrianTaiwaneseThaiTlingit-HaidaTohono O'OdhamTonganTrinidadian and TobagonianTsimshianTurkishU.S. Virgin IslanderUgandanUkrainianUruguayanUteVenezuelanVietnameseWelshWest IndianYakamaYaquiYugoslavianYumanYup'ikZimbabwean
Immigration
NonimmigrantsImmigrantsAfghanistanAfricaAlbaniaArgentinaArmeniaAsiaAustraliaAustriaBahamasBangladeshBarbadosBelarusBelgiumBelizeBoliviaBosnia and HerzegovinaBrazilBulgariaBurma/MyanmarCabo VerdeCambodiaCameroonCanadaCaribbeanCentral AmericaChileChinaColombiaCongoCosta RicaCroatiaCubaCzechoslovakiaDenmarkDominicaDominican RepublicEastern AfricaEastern AsiaEastern EuropeEcuadorEgyptEl SalvadorEnglandEritreaEthiopiaEuropeFijiFranceGermanyGhanaGreeceGrenadaGuatemalaGuyanaHaitiHondurasHong KongHungaryIndiaIndonesiaIranIraqIrelandIsraelItalyJamaicaJapanJordanKazakhstanKenyaKoreaKuwaitLaosLatin AmericaLatviaLebanonLiberiaLithuaniaMalaysiaMexicoMicronesiaMiddle AfricaMoldovaMoroccoNepalNetherlandsNicaraguaNigeriaNorth AmericaNorth MacedoniaNorthern AfricaNorthern EuropeNorwayOceaniaPakistanPanamaPeruPhilippinesPolandPortugalRomaniaRussiaSaudi ArabiaScotlandSenegalSerbiaSierra LeoneSingaporeSomaliaSouth AfricaSouth AmericaSouth Central AsiaSouth Eastern AsiaSouthern EuropeSpainSri LankaSt. Vincent and the GrenadinesSudanSwedenSwitzerlandSyriaTaiwanThailandTrinidad and TobagoTurkeyUgandaUkraineUruguayUzbekistanVenezuelaVietnamWest IndiesWestern AfricaWestern AsiaWestern EuropeYemenZaireZimbabweAzores
Select to Compare
Race
Ancestry
AfghanAfricanAlaska NativeAlaskan AthabascanAlbanianAleutAlsatianAmericanApacheArabArapahoArgentineanArmenianAssyrian/Chaldean/SyriacAustralianAustrianBahamianBangladeshiBarbadianBasqueBelgianBelizeanBermudanBhutaneseBlackfeetBolivianBrazilianBritishBritish West IndianBulgarianBurmeseCajunCambodianCanadianCape VerdeanCarpatho RusynCelticCentral AmericanCentral American IndianCherokeeCheyenneChickasawChileanChineseChippewaChoctawColombianColvilleComancheCosta RicanCreeCreekCroatianCrowCubanCypriotCzechCzechoslovakianDanishDelawareDominicanDutchDutch West IndianEastern EuropeanEcuadorianEgyptianEnglishEstonianEthiopianEuropeanFijianFilipinoFinnishFrenchFrench American IndianFrench CanadianGermanGerman RussianGhanaianGreekGuamanian/ChamorroGuatemalanGuyaneseHaitianHmongHonduranHopiHoumaHungarianIcelanderIndian (Asian)IndonesianInupiatIranianIraqiIrishIroquoisIsraeliItalianJamaicanJapaneseJordanianKenyanKiowaKoreanLaotianLatvianLebaneseLiberianLithuanianLumbeeLuxembourgerMacedonianMalaysianMalteseMarshalleseMenomineeMexicanMexican American IndianMongolianMoroccanNative HawaiianNavajoNepaleseNew ZealanderNicaraguanNigerianNorthern EuropeanNorwegianOkinawanOsageOttawaPaiutePakistaniPalestinianPanamanianParaguayanPennsylvania GermanPeruvianPimaPolishPortuguesePotawatomiPuebloPuerto RicanPuget Sound SalishRomanianRussianSalvadoranSamoanScandinavianScotch-IrishScottishSeminoleSenegaleseSerbianShoshoneSierra LeoneanSiouxSlavicSlovakSloveneSomaliSouth AfricanSouth AmericanSouth American IndianSoviet UnionSpaniardSpanishSpanish AmericanSpanish American IndianSri LankanSubsaharan AfricanSudaneseSwedishSwissSyrianTaiwaneseThaiTlingit-HaidaTohono O'OdhamTonganTrinidadian and TobagonianTsimshianTurkishU.S. Virgin IslanderUgandanUkrainianUruguayanUteVenezuelanVietnameseWelshWest IndianYakamaYaquiYugoslavianYumanYup'ikZimbabwean
Immigration
NonimmigrantsImmigrantsAfghanistanAfricaAlbaniaArgentinaArmeniaAsiaAustraliaAustriaBahamasBangladeshBarbadosBelarusBelgiumBelizeBoliviaBosnia and HerzegovinaBrazilBulgariaBurma/MyanmarCabo VerdeCambodiaCameroonCanadaCaribbeanCentral AmericaChileChinaColombiaCongoCosta RicaCroatiaCubaCzechoslovakiaDenmarkDominicaDominican RepublicEastern AfricaEastern AsiaEastern EuropeEcuadorEgyptEl SalvadorEnglandEritreaEthiopiaEuropeFijiFranceGermanyGhanaGreeceGrenadaGuatemalaGuyanaHaitiHondurasHong KongHungaryIndiaIndonesiaIranIraqIrelandIsraelItalyJamaicaJapanJordanKazakhstanKenyaKoreaKuwaitLaosLatin AmericaLatviaLebanonLiberiaLithuaniaMalaysiaMexicoMicronesiaMiddle AfricaMoldovaMoroccoNepalNetherlandsNicaraguaNigeriaNorth AmericaNorth MacedoniaNorthern EuropeNorwayOceaniaPakistanPanamaPeruPhilippinesPolandPortugalRomaniaRussiaSaudi ArabiaScotlandSenegalSerbiaSierra LeoneSingaporeSomaliaSouth AfricaSouth AmericaSouth Central AsiaSouth Eastern AsiaSouthern EuropeSpainSri LankaSt. Vincent and the GrenadinesSudanSwedenSwitzerlandSyriaTaiwanThailandTrinidad and TobagoTurkeyUgandaUkraineUruguayUzbekistanVenezuelaVietnamWest IndiesWestern AfricaWestern AsiaWestern EuropeYemenZaireZimbabweAzores
3 or more Vehicles in Household
Income
Poverty
Unemployment
Labor Participation
Family Structure
Vehicle Availability
Education Level
Disability

Immigrants from Northern Africa 3 or more Vehicles in Household
Tragic

17.8%
3+ VEHICLES AVAILABLE
0.9/ 100
METRIC RATING
261st/ 347
METRIC RANK

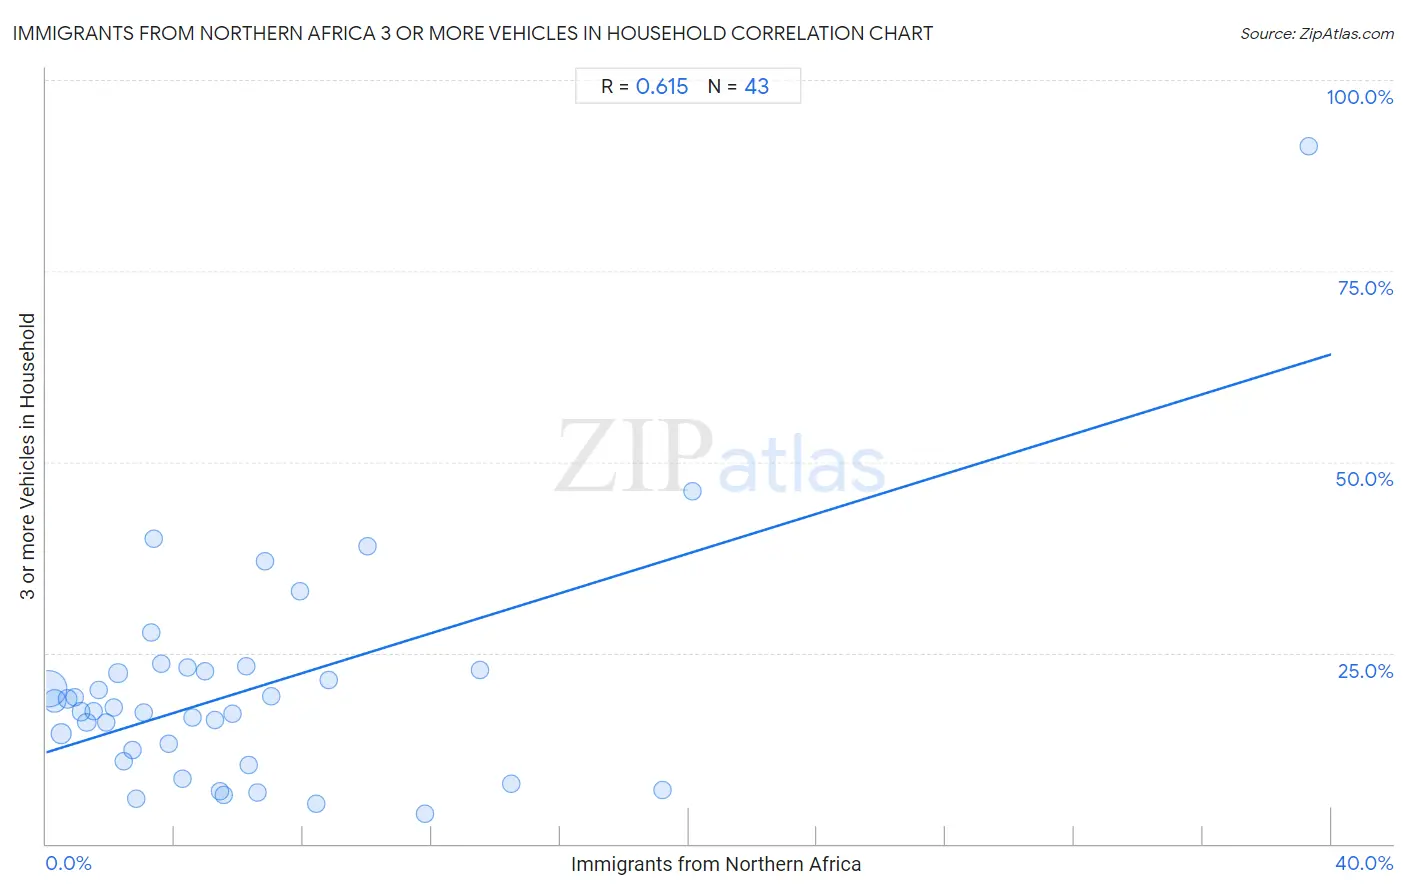
Immigrants from Northern Africa 3 or more Vehicles in Household Correlation Chart

The statistical analysis conducted on geographies consisting of 321,034,872 people shows a significant positive correlation between the proportion of Immigrants from Northern Africa and percentage of households with 3 or more vehicles available in the United States with a correlation coefficient (R) of 0.615 and weighted average of 17.8%. On average, for every 1% (one percent) increase in Immigrants from Northern Africa within a typical geography, there is an increase of 1.3% in percentage of households with 3 or more vehicles available.
Immigrants from Northern Africa 3 or more Vehicles in Household
It is essential to understand that the correlation between the percentage of Immigrants from Northern Africa and percentage of households with 3 or more vehicles available does not imply a direct cause-and-effect relationship. It remains uncertain whether the presence of Immigrants from Northern Africa influences an upward or downward trend in the level of percentage of households with 3 or more vehicles available within an area, or if Immigrants from Northern Africa simply ended up residing in those areas with higher or lower levels of percentage of households with 3 or more vehicles available due to other factors.

Demographics Similar to Immigrants from Northern Africa by 3 or more Vehicles in Household

In terms of 3 or more vehicles in household, the demographic groups most similar to Immigrants from Northern Africa are Ugandan (17.8%, a difference of 0.020%), Colombian (17.8%, a difference of 0.030%), Bermudan (17.8%, a difference of 0.14%), Uruguayan (17.8%, a difference of 0.15%), and Cambodian (17.8%, a difference of 0.16%).
DemographicsRating | Rank3 or more Vehicles in Household
Ethiopians
1.2
/100
|
#254
Tragic
17.9%
Immigrants from Turkey
1.2
/100
|
#255
Tragic
17.9%
Sub-Saharan Africans
1.1
/100
|
#256
Tragic
17.9%
Immigrants from Eritrea
1.1
/100
|
#257
Tragic
17.8%
Sudanese
1.1
/100
|
#258
Tragic
17.8%
Uruguayans
1.0
/100
|
#259
Tragic
17.8%
Ugandans
0.9
/100
|
#260
Tragic
17.8%
Immigrants from Northern Africa
0.9
/100
|
#261
Tragic
17.8%
Colombians
0.9
/100
|
#262
Tragic
17.8%
Bermudans
0.9
/100
|
#263
Tragic
17.8%
Cambodians
0.9
/100
|
#264
Tragic
17.8%
Immigrants from Panama
0.8
/100
|
#265
Tragic
17.7%
Macedonians
0.8
/100
|
#266
Tragic
17.7%
Immigrants from Venezuela
0.8
/100
|
#267
Tragic
17.7%
Immigrants from Bulgaria
0.8
/100
|
#268
Tragic
17.7%

Immigrants from Northern Africa 3 or more Vehicles in Household Correlation Summary

MeasurementImmigrants from Northern Africa Data3 or more Vehicles in Household Data
Minimum0.085%3.9%
Maximum39.3%91.3%
Range39.2%87.4%
Mean6.2%20.0%
Median4.4%17.4%
Interquartile 25% (IQ1)2.1%10.8%
Interquartile 75% (IQ3)7.0%22.7%
Interquartile Range (IQR)4.9%11.9%
Standard Deviation (Sample)7.0%14.8%
Standard Deviation (Population)6.9%14.6%

Correlation Details

Immigrants from Northern Africa PercentileSample Size3 or more Vehicles in Household
[
0.0%
-
0.5%
]
0.085%
203,305,62820.4%
[
0.0%
-
0.5%
]
0.27%
61,379,03618.7%
[
0.0%
-
0.5%
]
0.46%
28,709,37214.4%
[
0.5%
-
1.0%
]
0.67%
10,867,31319.0%
[
0.5%
-
1.0%
]
0.88%
5,059,12319.1%
[
1.0%
-
1.5%
]
1.09%
4,023,94217.3%
[
1.0%
-
1.5%
]
1.26%
2,404,85015.9%
[
1.0%
-
1.5%
]
1.48%
1,354,06917.4%
[
1.5%
-
2.0%
]
1.64%
831,15020.2%
[
1.5%
-
2.0%
]
1.86%
919,04015.9%
[
2.0%
-
2.5%
]
2.09%
220,91917.8%
[
2.0%
-
2.5%
]
2.24%
441,66322.3%
[
2.0%
-
2.5%
]
2.43%
165,13510.8%
[
2.5%
-
3.0%
]
2.70%
185,87612.2%
[
2.5%
-
3.0%
]
2.81%
389,4865.9%
[
3.0%
-
3.5%
]
3.04%
58,93117.2%
[
3.0%
-
3.5%
]
3.27%
58,80827.7%
[
3.0%
-
3.5%
]
3.35%
14,10239.9%
[
3.5%
-
4.0%
]
3.58%
24,40823.6%
[
3.5%
-
4.0%
]
3.80%
22,32413.1%
[
4.0%
-
4.5%
]
4.22%
47,3208.5%
[
4.0%
-
4.5%
]
4.41%
12,42423.1%
[
4.5%
-
5.0%
]
4.56%
33,62716.5%
[
4.5%
-
5.0%
]
4.96%
46,88722.6%
[
5.0%
-
5.5%
]
5.24%
223,53216.1%
[
5.0%
-
5.5%
]
5.41%
3,1626.8%
[
5.5%
-
6.0%
]
5.53%
51,6956.4%
[
5.5%
-
6.0%
]
5.80%
3,31317.0%
[
6.0%
-
6.5%
]
6.22%
8,81523.2%
[
6.0%
-
6.5%
]
6.32%
140,99410.3%
[
6.5%
-
7.0%
]
6.58%
5,0006.7%
[
6.5%
-
7.0%
]
6.82%
1,36337.0%
[
6.5%
-
7.0%
]
6.99%
14319.4%
[
7.5%
-
8.0%
]
7.90%
6,93833.1%
[
8.0%
-
8.5%
]
8.40%
7505.3%
[
8.5%
-
9.0%
]
8.81%
1,33921.4%
[
10.0%
-
10.5%
]
10.02%
5,75138.9%
[
11.5%
-
12.0%
]
11.78%
3,0563.9%
[
13.0%
-
13.5%
]
13.49%
1,39422.7%
[
14.0%
-
14.5%
]
14.46%
3327.9%
[
19.0%
-
19.5%
]
19.16%
9817.1%
[
20.0%
-
20.5%
]
20.12%
82546.2%
[
39.0%
-
39.5%
]
39.29%
5691.3%